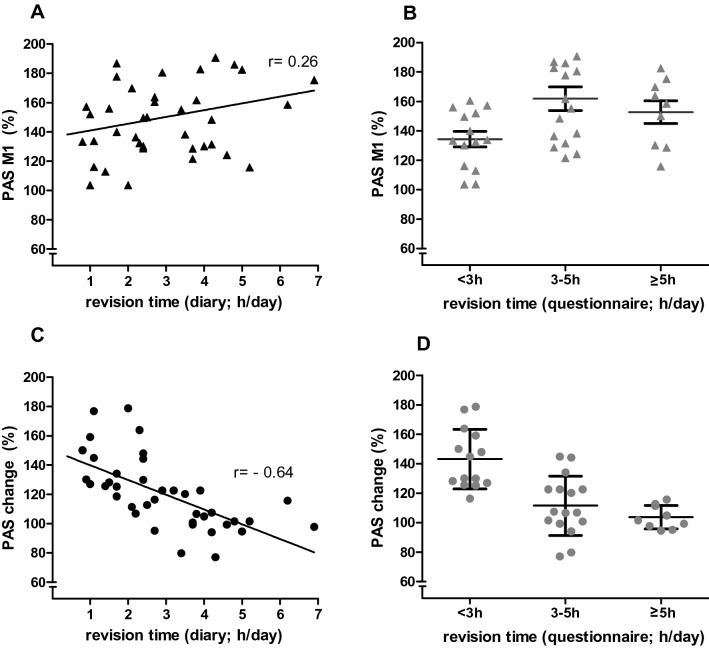
Fig. 5.
The linear regression between the revision time as given in the diary (h/day; x-axis; a and c) and in the questionnaire (h/day; x-axis; b and d) with PAS M1 (a, b) and with PAS change (c, d; y-axis), respectively. The results of the correlation analyses are given in the figures. For the scatter diagrams (b, d) the subjects who revised ≥ 5 h/day were summarised into one group. The horizontal line within each scatter represents the mean (± SEM; error bars)

