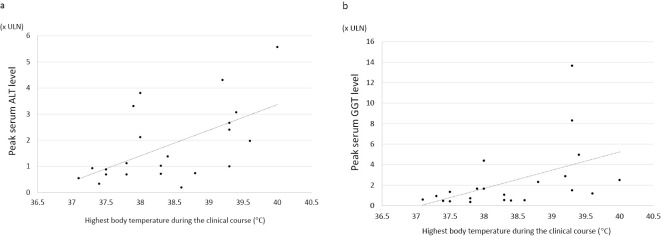
Figure.
a: The scatter plot of the highest body temperatures during the clinical course and the peak serum alanine aminotransferase (ALT) levels. Each dot represents each patient’s temperature and ALT level. b: The scatter plot of the highest body temperatures during the clinical course and the peak serum gamma-glutamyl transferase (GGT) level. Each dot represents each patient’s temperature and GGT level. Since the ULN differed between men (64 U/L) and women (34 U/L), the serum value of GGT was shown as xULN.

