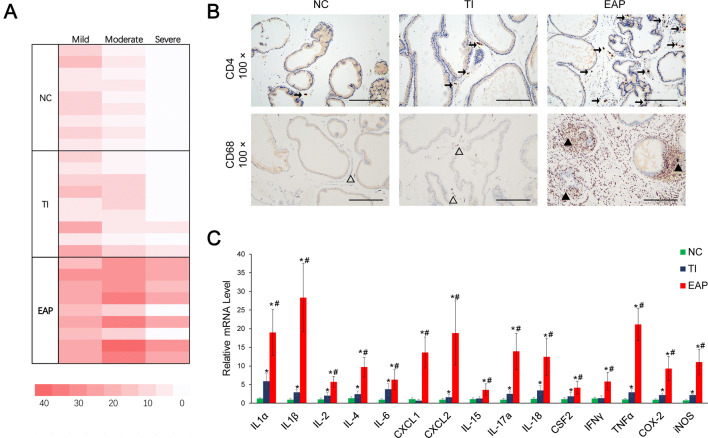
Fig. 2.
Inflammation degree and cytokine levels in the prostate samples. a Inflammation degree and percentage of inflammatory foci/mm2 in the prostate sections. b IHC staining for detecting CD3 (upper panel) and CD68 (lower panel) in the rat prostate samples was performed to characterize the infiltrated T cells and macrophages, respectively. The black arrow indicates the CD3-positive cells. The open triangles indicate the presence of a small number of infiltrated macrophages, while the black solid triangles indicate the presence of a large number of infiltrated macrophages. c The expression of the mRNAs of various cytokine genes relative to that of β actin. Each bar in the graph represents the mean ± S.D. *Significant difference compared to the NC group, P < 0.05; #Significant difference compared to the TI group, P < 0.05

