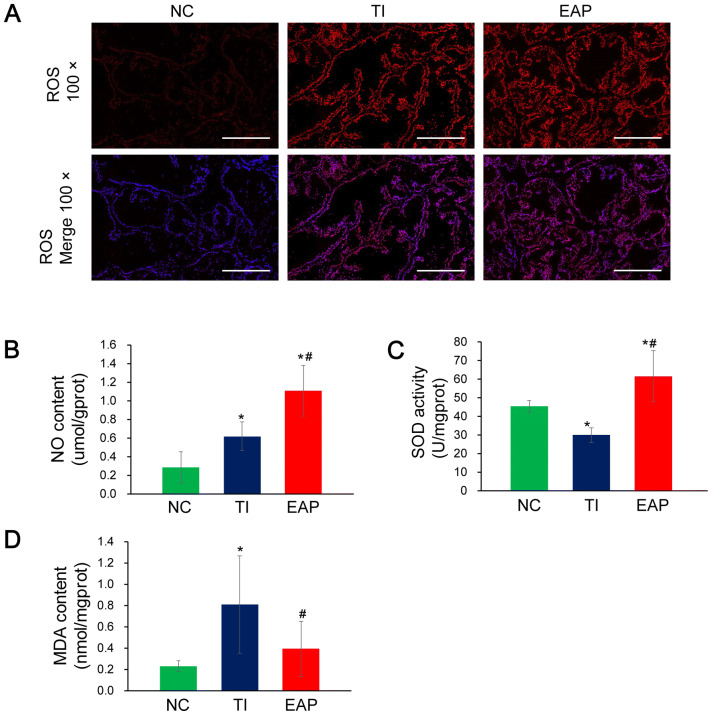
Fig. 4.
Indicators reflecting the oxidative stress in the prostate samples. a ROS produced in situ was assessed using the fluorescent probe DHE. b NO concentrations in samples from rats in all the groups. c SOD activity in samples from rats in all the groups (assessed using an assay kit: WST-1 method). d MDA concentrations in samples from rats in all the groups. Each bar in the graphs represents the mean ± S.D. *Significant difference compared to the NC group, P < 0.05; #Significant difference compared to the TI group, P < 0.05

