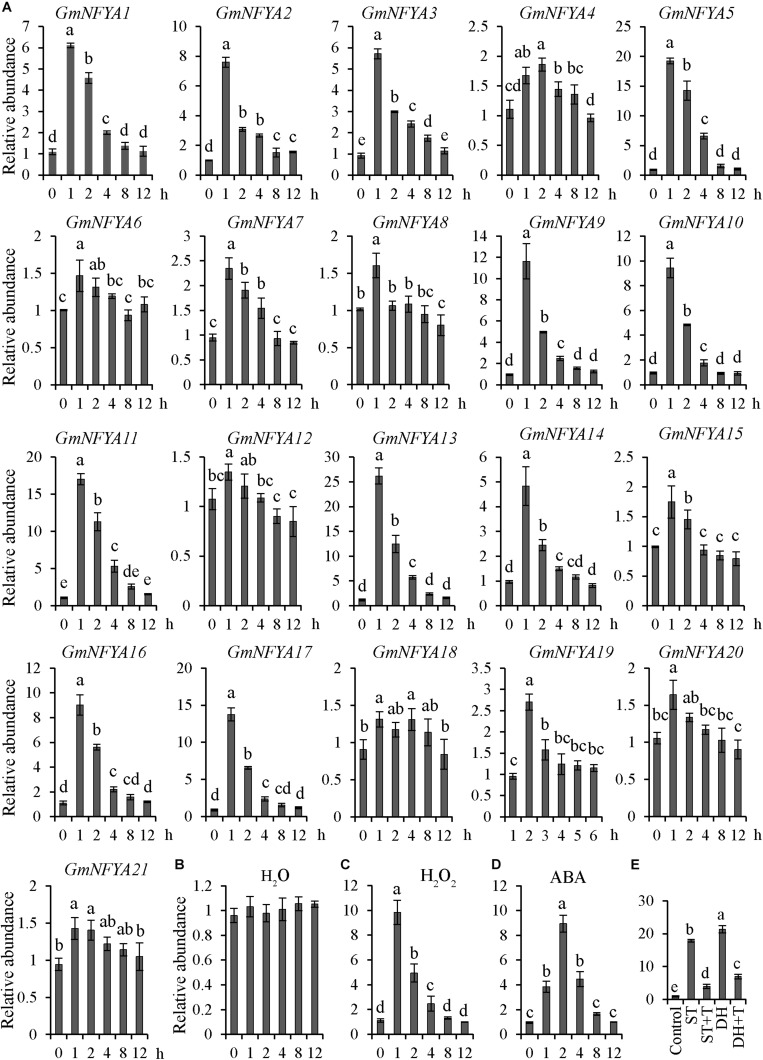
FIGURE 1.
GmNFYA13 transcripts were induced by treatment of salt, H2O2, and ABA. (A) The expression levels of 21 NF-YA members in Glycine max were evaluated with qRT-PCR under salt treatment. (B–D) H2O, H2O2, and ABA induced GmNFYA13 transcripts. (E) Tungstate suppressed salt- and drought-induced GmNFYA13 transcripts. Control, salt, salt + tungstate, drought, and drought + tungstate are indicated by CTR, ST, ST + T, DH, and DH + T, respectively. GmCYP2 was used as the internal control and transcripts of all genes used in the assay were normalized to the non-treated expression level, which was set as 1.0. Data indicate three biological replicates ± SD. Different letters above the columns represent significant differences at P < 0.05.

