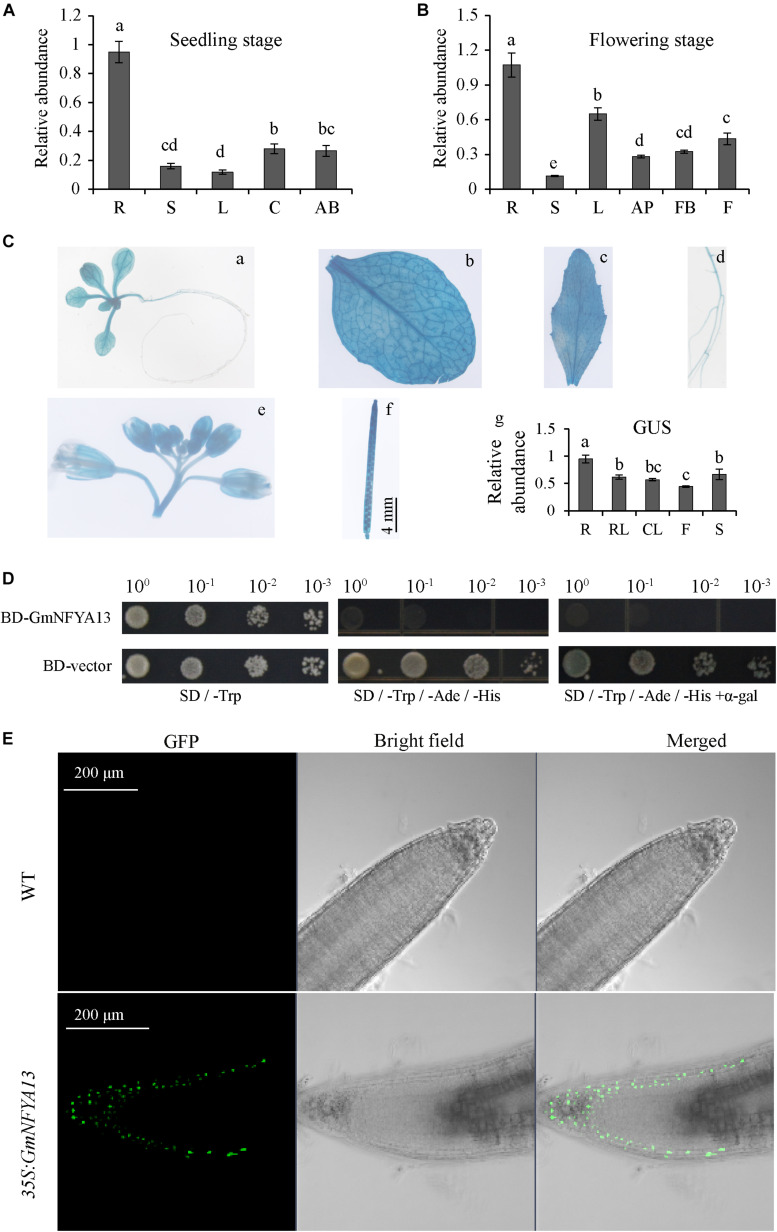
FIGURE 2.
Analysis of tissue-specific expression, self-activating activity, and subcellular localization of GmNFYA13. (A,B) GmNFYA13 transcripts were assessed in various tissues at two growth periods. The expression level of GmNFYA13 in roots was set as 1.0, and GmCYP2 was the internal control. Data indicate three biological replicates ± SD. Different letters above the columns represent significant differences at P < 0.05. (C) GUS staining in each tissue in PGmNFYA13:GUS transgenic Arabidopsis plants. a, 5-day-old seedling; b, rosette leaf (RL); c, cauline leaf (CL); d, root (R); e, flower (F); f, silique (S); g, transcripts of GUS were measured in various tissues of transgenic Arabidopsis by qRT-PCR. Scale bar = 4 mm. The transcripts of GUS in roots were set as 1.0, and AtTub8 was the internal control. Data indicate three biological replicates ± SD. Different letters above the columns represent significant differences at P < 0.05. (D) Self-activating activity analysis of GmNFYA13. (E) GFP fluorescence was detected in roots of WT and 35S:GmNFYA13 Arabidopsis plants. Scale bar = 200 μm. Each experiment had three biological replicates.

