Fig. 5.
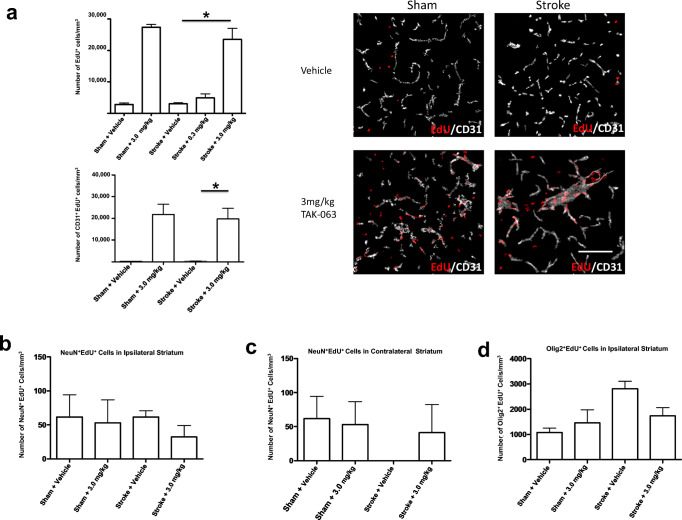
Effects of PDE10A inhibition on angiogenesis, neurogenesis, and gliogenesis in post-striatal stroke. a (upper panel) Total EdU+ cells were increased at 6 weeks post-striatal stroke in contralateral striatum in stroke +3.0 mg/kg versus stroke + vehicle; *P < 0.0001 (F(4,15) = 32.6). a (lower panel) EdU+CD31+ cells were increased at 6 weeks post-striatal stroke in striatal tissue contralateral to the infarct. Representative images of EdU+CD31+ cells in contralateral striatum. From top left: sham + vehicle; bottom left: sham + 3.0 mg/kg. Top right: stroke + vehicle; bottom right: stroke +3.0 mg/kg. a (lower panel) Treatment with TAK-063 resulted in a significant increase in EdU+CD31+ cells in the stroke + 3.0 mg/kg versus stroke + vehicle group; *P = 0.0201. No differences were observed in sham +3.0 mg/kg and stroke + 3.0 mg/kg. Error bars represent mean ± SEM for n = 3–5 per group, F(3,9) = 9.700. b, c NeuN+ EdU+ cells showed no differences between groups at 6 weeks post-striatal stroke in contralateral and ipsilateral striatum. Error bars represent mean ± SEM for n = 3 per group, b F(3,8) = 0.3004, c F(3,8) = 0.7663. d Olig2+ EdU+ cells showed no differences between groups in ipsilateral striatum. Error bars represent mean ± SEM for n = 3–4 per group, F(3, 10) = 4.040. Scale bar = 50 μm and applies to all photomicrographs.

