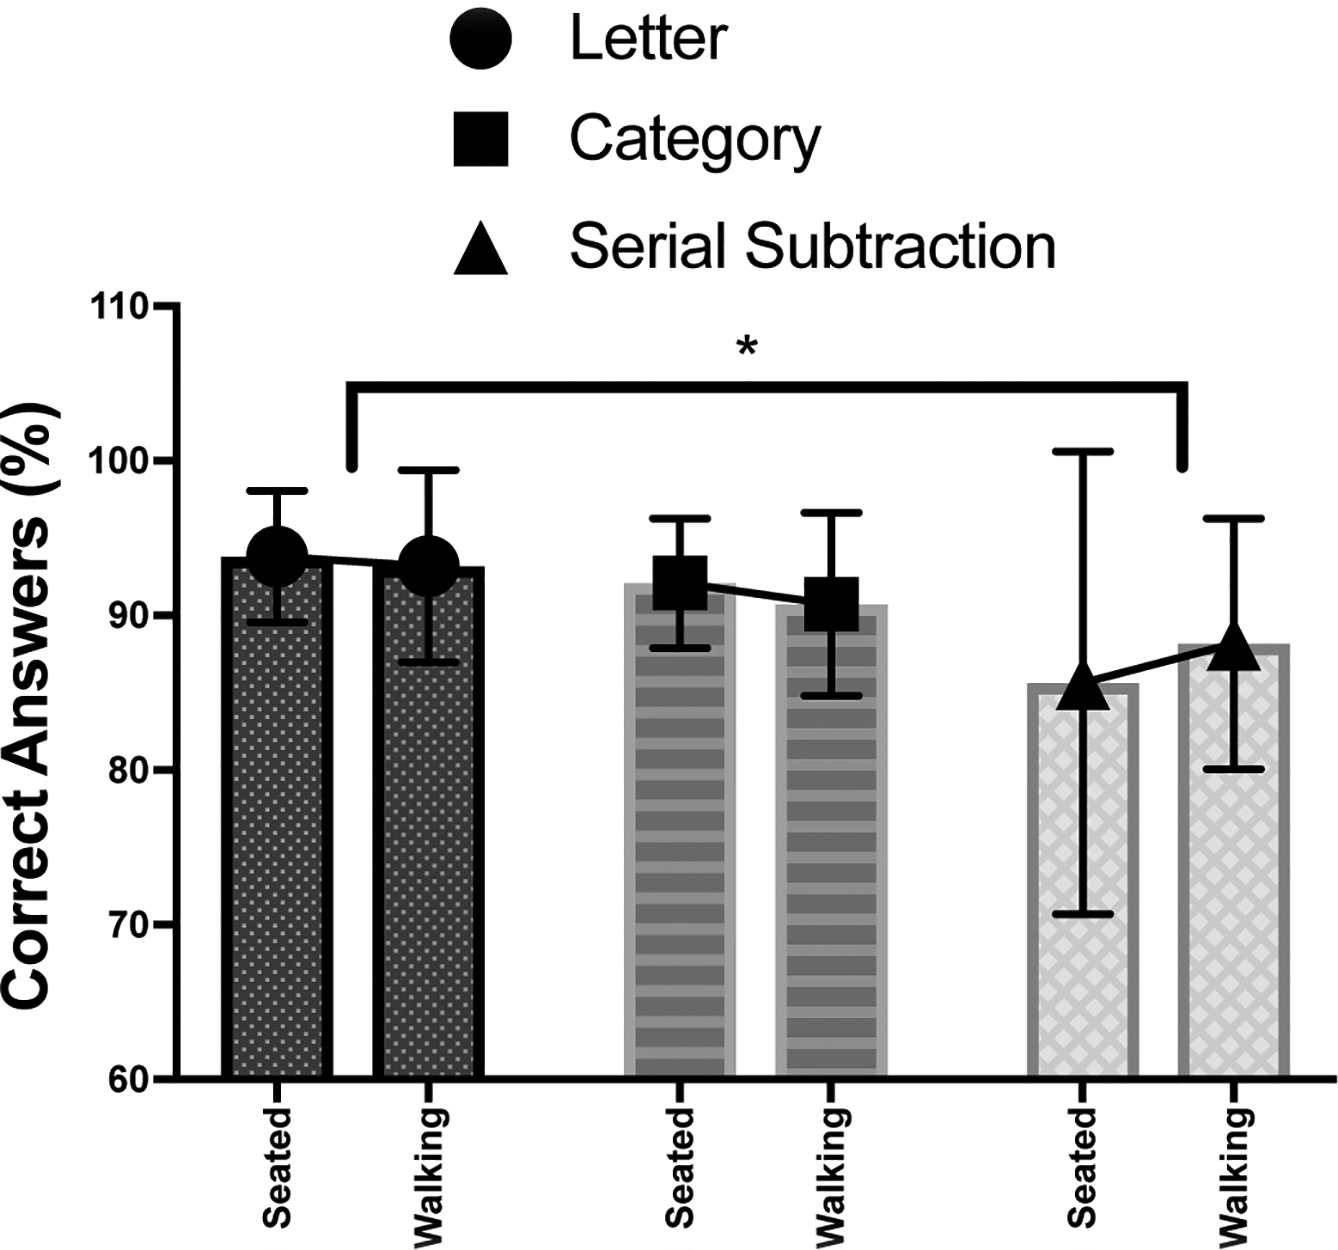
Fig. 2.

Comparison of the cognitive scores between seated and walking conditions for each cognitive task: letter fluency (circle), category fluency (square), and serial subtraction by 3 (triangle). Cognitive scores were calculated as the percentage of correct answers. Signficant differences are noted with the horizontal bar, which were found from Post-hoc testing after the two-way repeated measure ANOVA.
