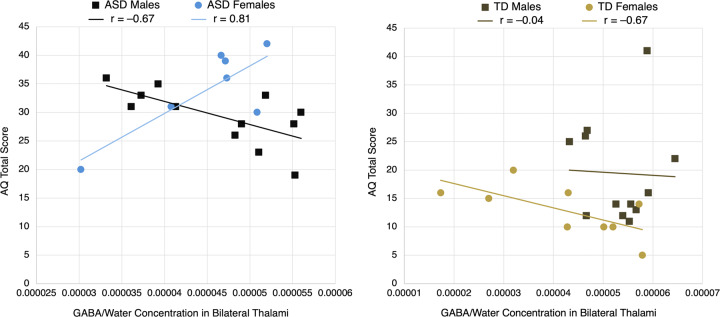
Fig. 3. Scatterplots, stratified by diagnosis, of AQ total score vs. thalamic GABA/Water concentration, with trendlines for each gender.
A significant interaction effect for ASD participants, but not TD participants, was found between gender and GABA in predicting AQ (P = 0.00071). Reported r values are simple correlation coefficients for each trendline.

