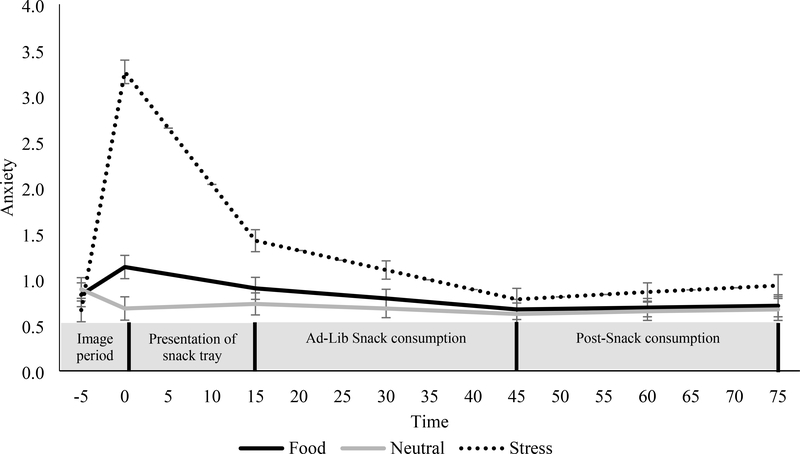
Figure 2. Changes in anxiety for the food, stress, and neutral cues during the image period, presentation of the snack tray, food consumption, and post-consumption period.
Mean ± SE. Anxiety was assessed using visual analog scales ranging from “not at all” (scored 0) to “extremely high” (scored 10). Analyses are adjusted for day of condition.

