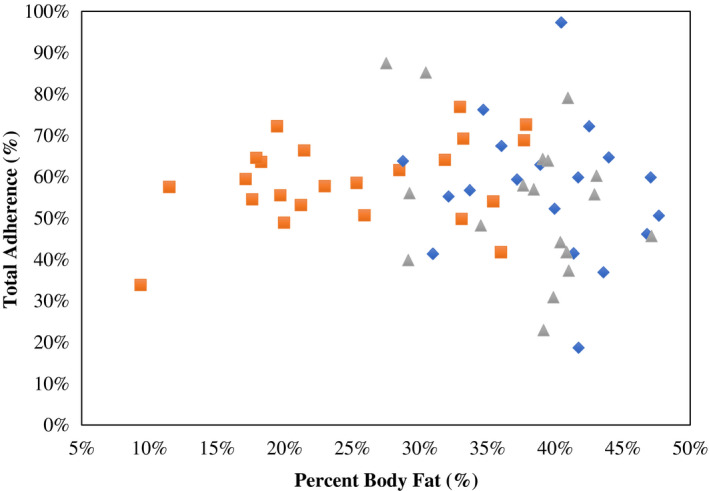
Figure 2.

Association between baseline percent body fat (PFAT) and total adherence scores (%); Pearson correlation coefficient (r) is reported along with its significance. Lean group is represented by orange squares, individuals with obesity calorie reduced (CR) by blue diamonds, and individuals with obesity weight‐maintaining energy needs (WMEN) by gray triangles. [Color figure can be viewed at wileyonlinelibrary.com]
