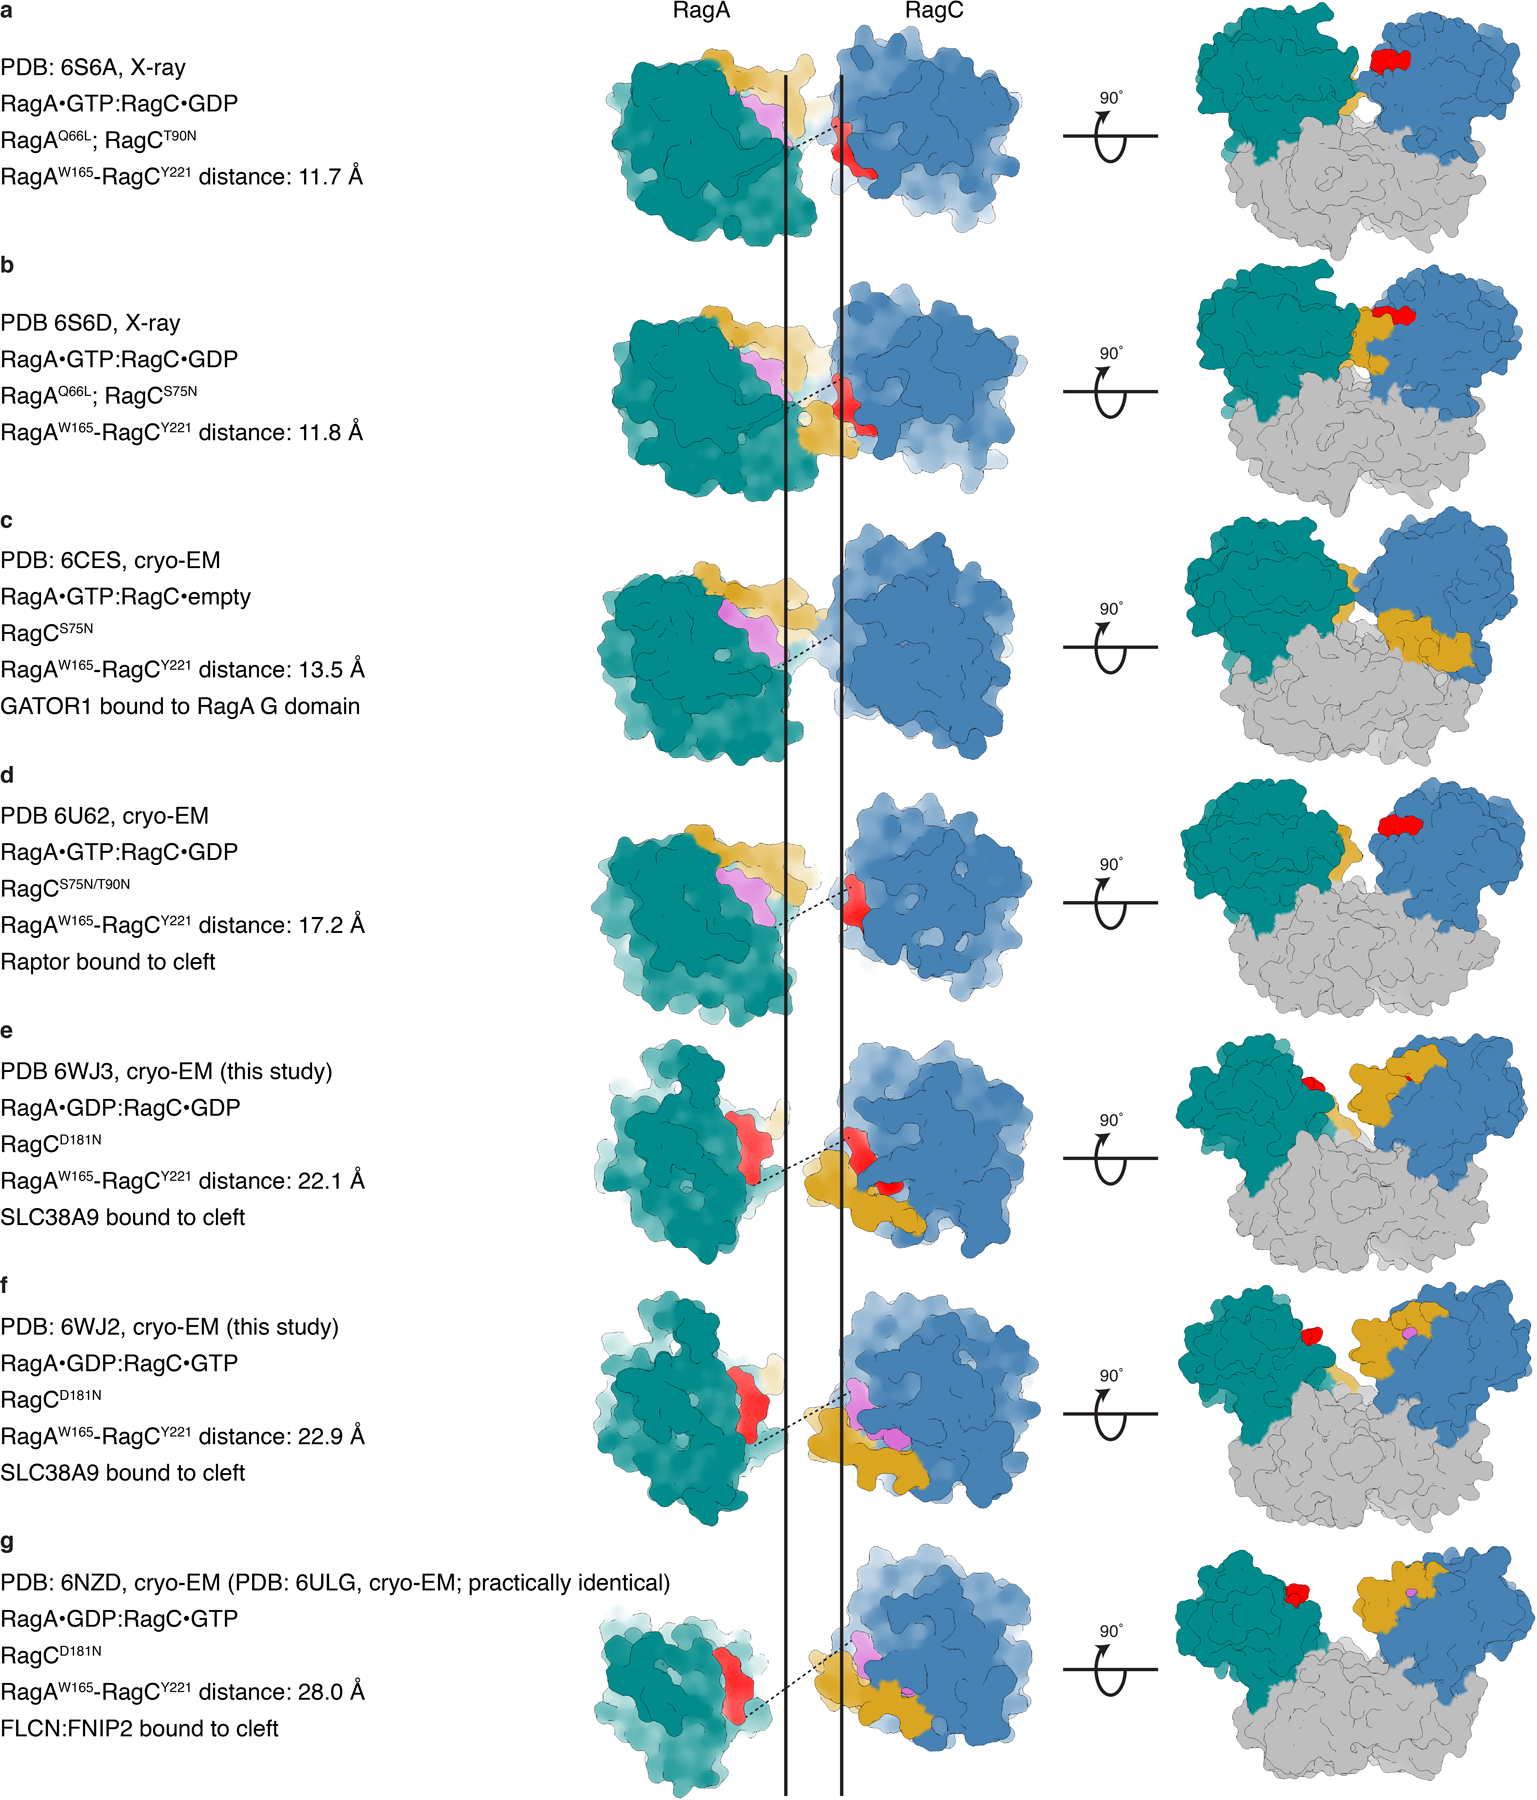
Extended Data Fig. 6. Overview of Rag GTPase structures in different states.

a–g, Top (middle) and side view (right) of published Rag GTPase structures in surface representation (cyan, RagA G domain; blue, RagC G domain; pink, GTP or GTP analogue; red, GDP or GDP analogue; yellow, RagA or RagC switch I region; grey, RagA or RagC C-terminal roadblock domain). The dashed line connects the Cα atoms of RagA Trp165 and RagC Tyr221 representing the width of the G domain cleft. The two vertical solid lines represent the RagA Trp165 and RagC Tyr221 Cα position in a. PDB codes, experimental method, de facto nucleotide state and Rag binding partners (if any) are summarized on the left.
