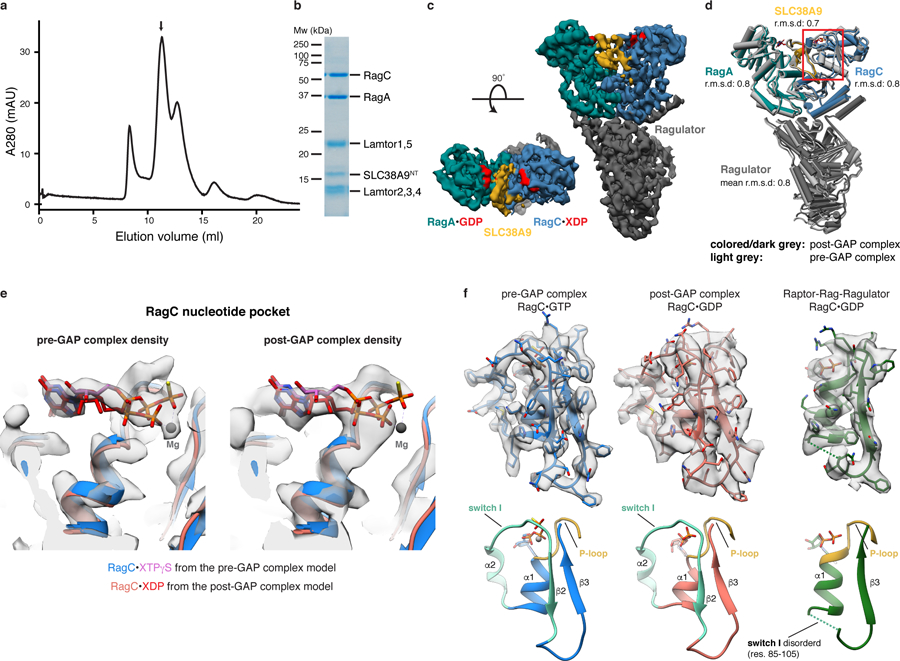
Fig. 4: Rag GTPases are trapped in the inactive conformation in the post-GAP complex.

a, SEC profile of the reconstituted SLC38A9NT-RagAGDP:RagCXDP-Ragulator complex. XDP, xanthosine di-phosphate serving as a GDP analogue. b, SDS-PAGE analysis of the peak fraction indicated in a. c, Cryo-EM density of the post-GAP complex. d, Overlay of the post-GAP (dark grey, colored) and pre-GAP (light grey) complex structures represented as pipes and planks. The boxed (red) region is show in e and f. e, Overlay of the pre (blue/pink) and post-GAP (light red/red) complex models focused on the RagC nucleotide pocket. Cryo-EM densities of the pre (left) and post-GAP (right) complexes are compared to highlight the clear distinction between the bound XTPγS and XDP, respectively. f, RagC nucleotide binding region of the pre-GAP (left, blue), post-GAP (middle, red) and Raptor-Rag-Ragulator (right, green, PDB: 6U62, EMD-20660) complex structures and respective cryo-EM density (top). Below, canonical small GTPase elements involved in nucleotide binding are highlighted in the models. Uncropped gel image for panel b is shown in the Source Data. Data for graph in a is available as source data online.
