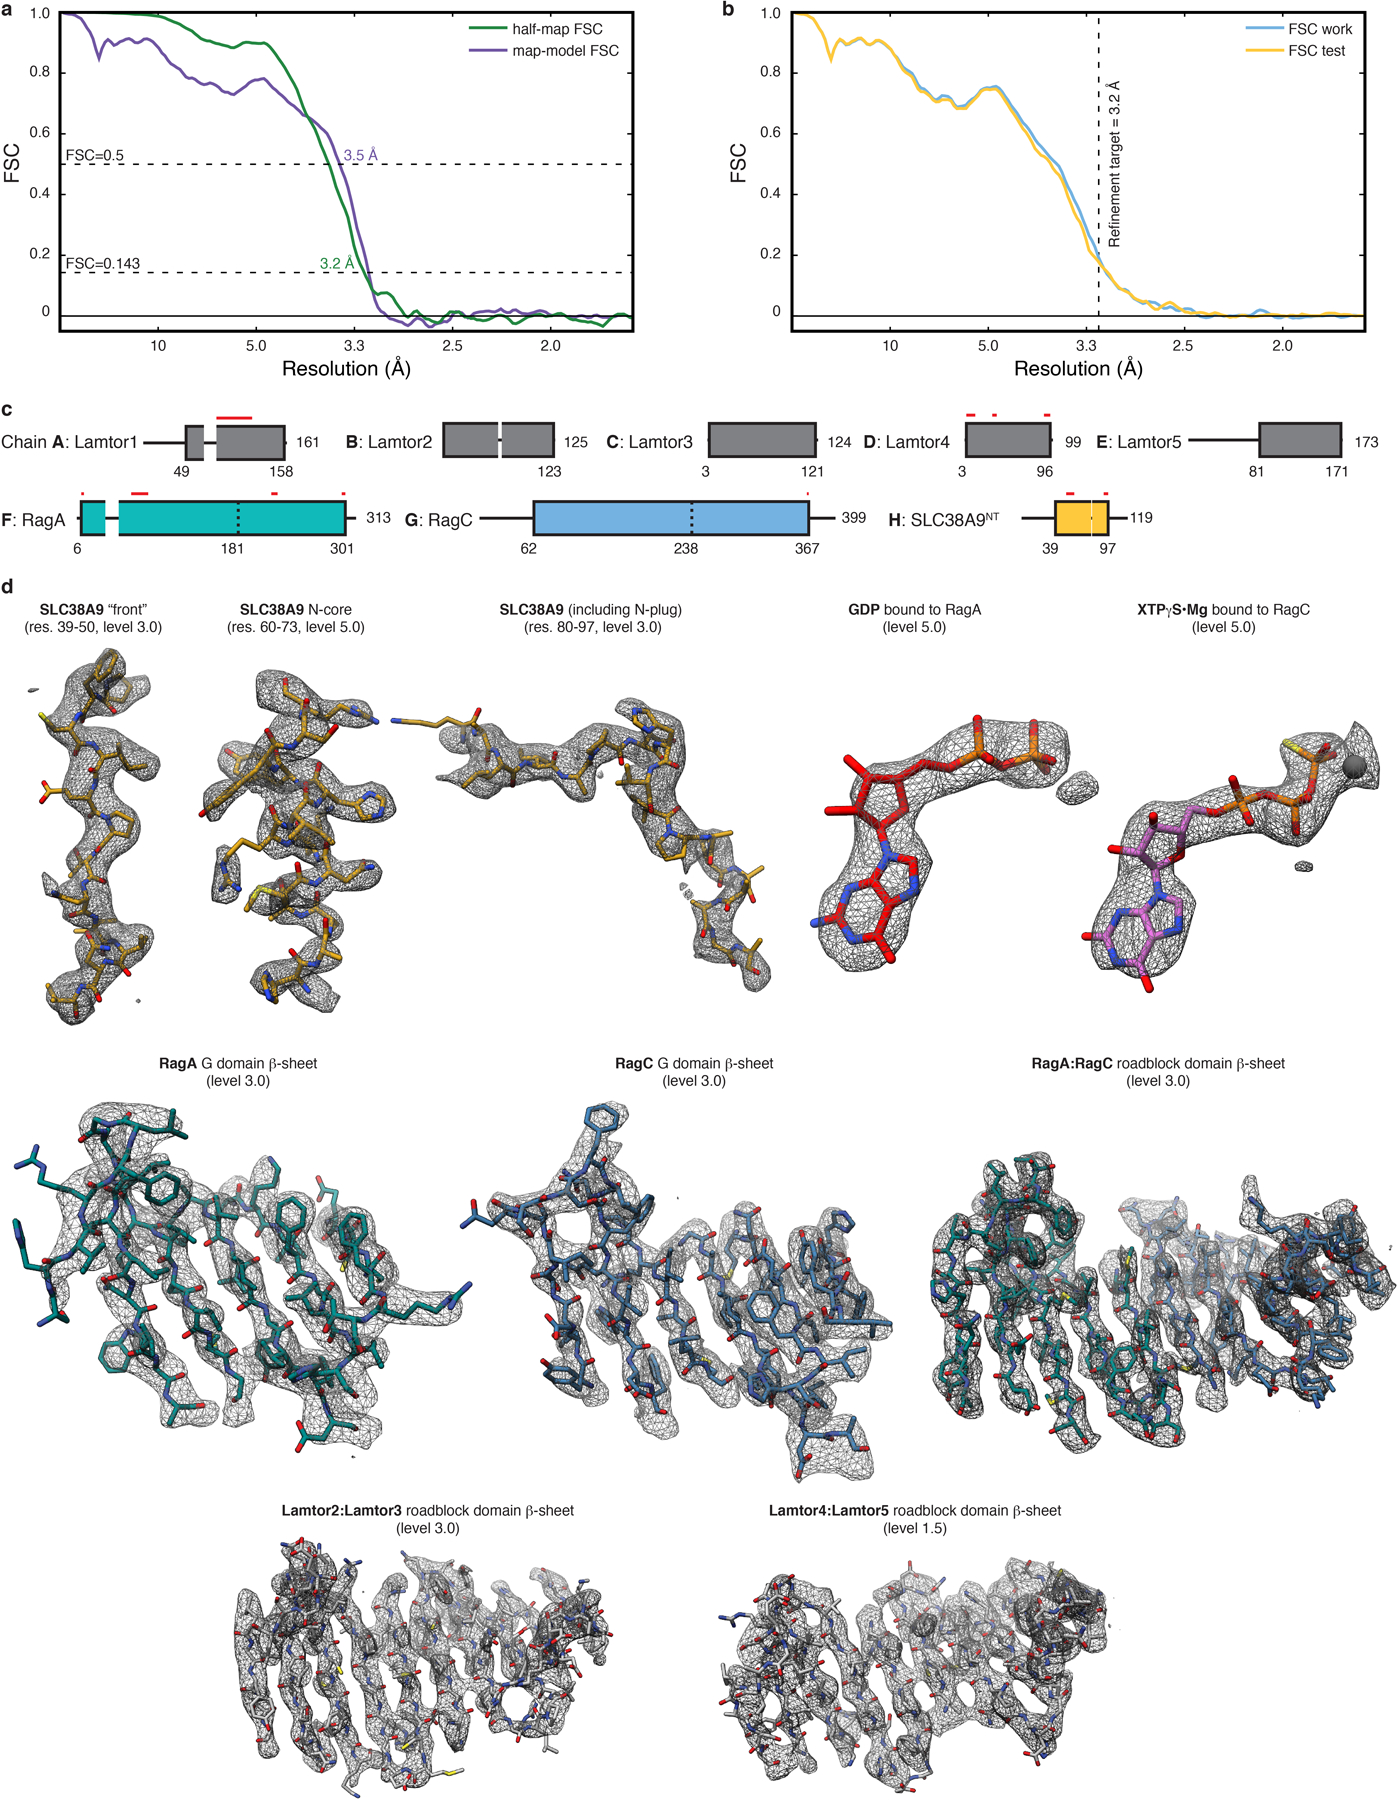
Extended Data Fig. 2. Pre-GAP complex atomic coordinate building and refinement.

a, Overlay of half-map (green) and map-model (purple) FSC to assess map to model agreement. b, Overlay of FSC work (blue) and FSC test (yellow) of the cross-validation test to assess overfitting. The refinement target resolution is indicated by a vertical dashed line. c, Final model composition and chain assignment. Parts not resolved by the cryo-EM density are represented by thin black lines. Red lines indicate regions where side chains are truncated to alanine. d, Model fit in the cryo-EM density (mesh) of selected regions. The threshold level used to display the density in UCSF Chimera is given in parentheses.
