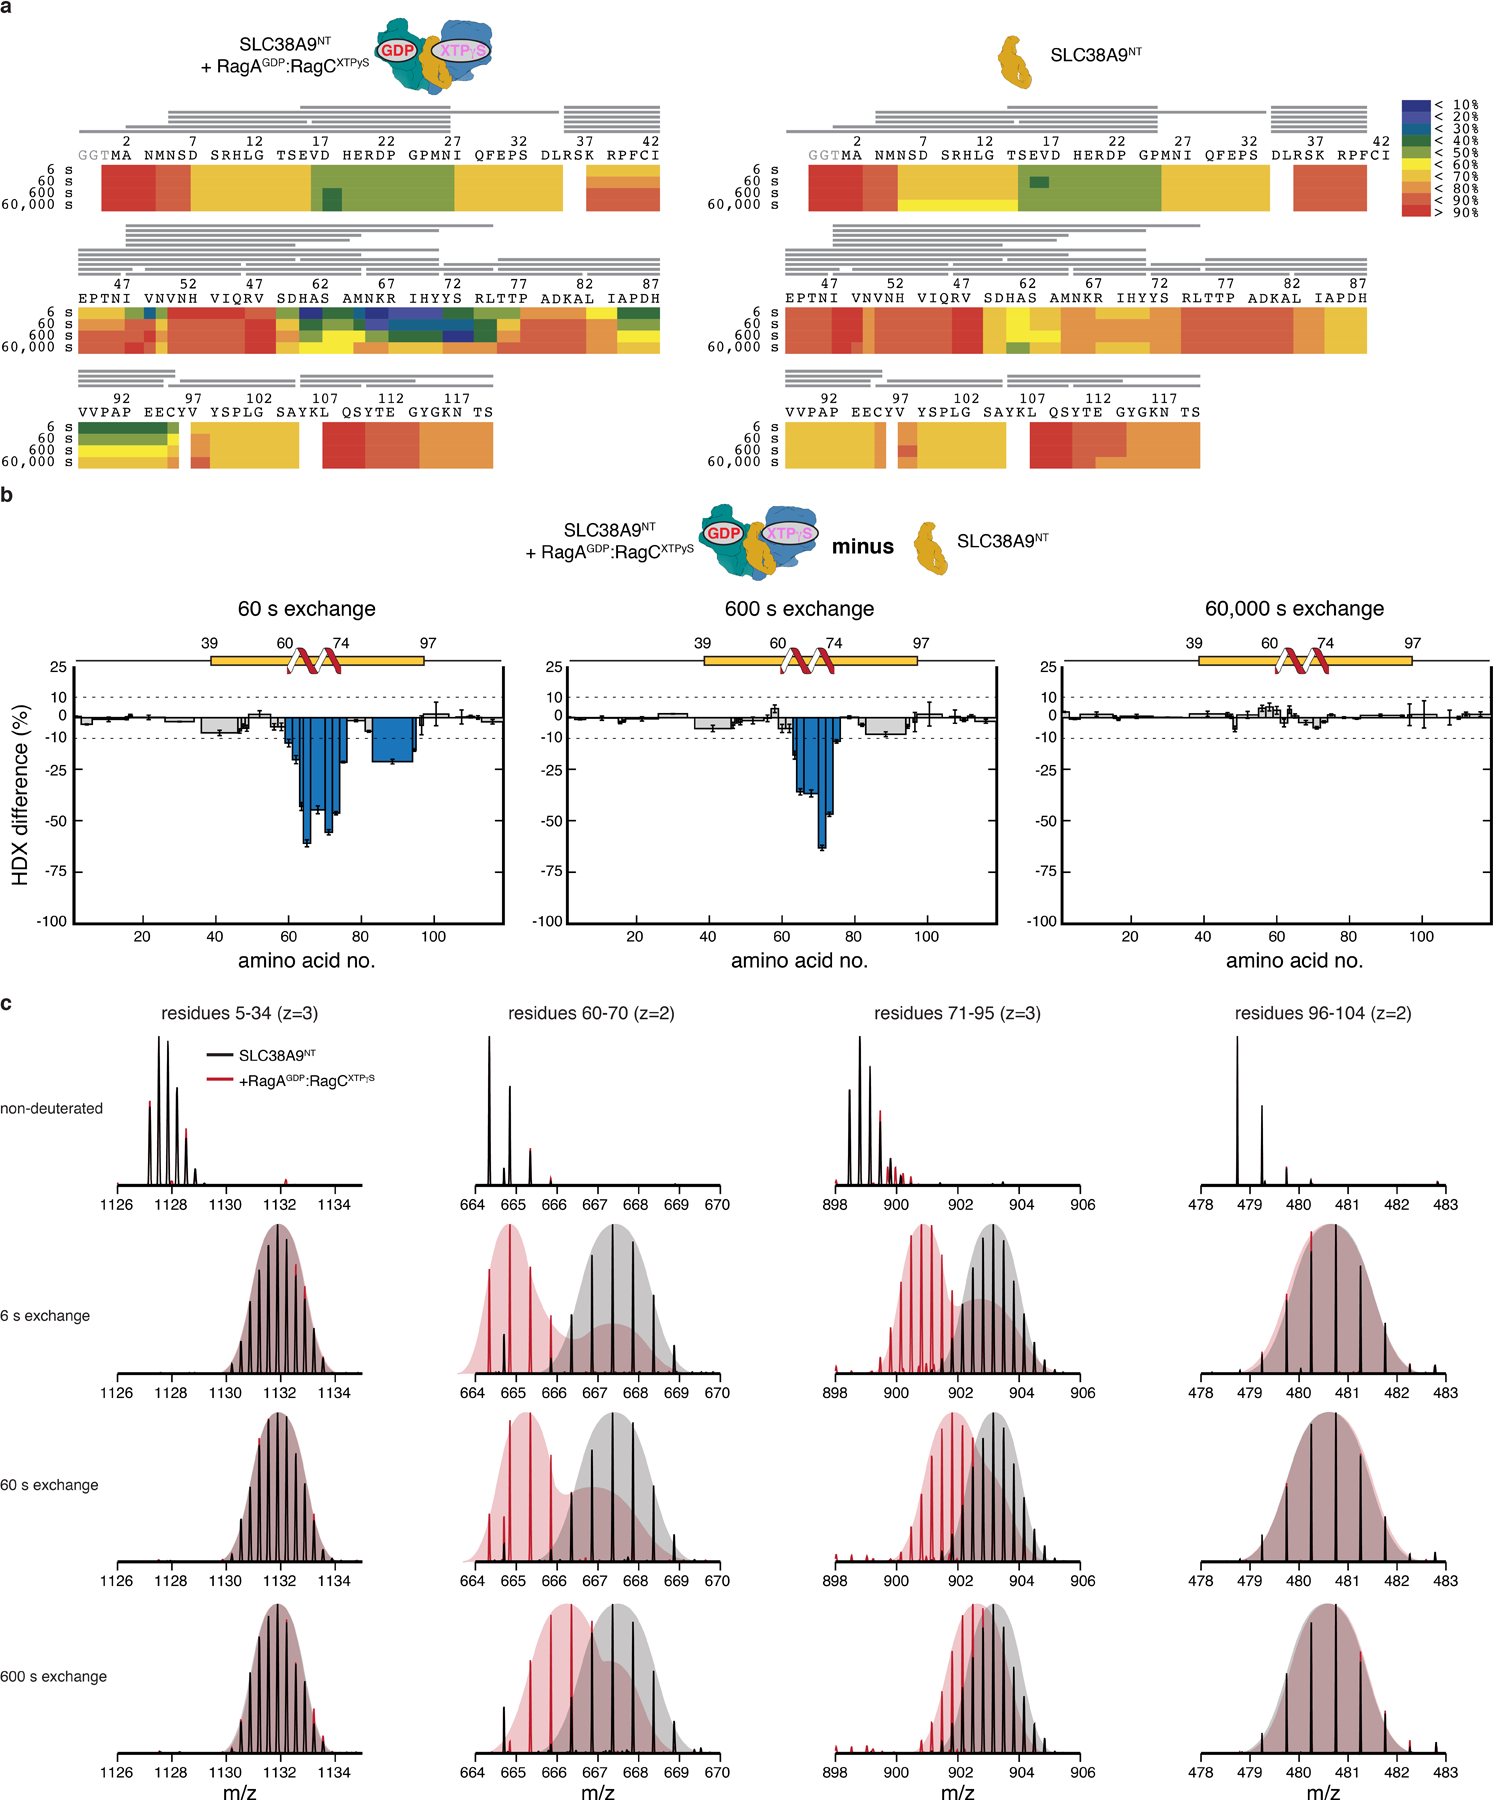
Extended Data Fig. 3. HDX-MS analysis of SLC38A9NT in isolation and bound to Rags.

a, Deuterium uptake and peptide coverage (grey lines) of SLC38A9NT in complex with inactive Rags (left) or in isolation (right) at 6, 60, 600 and 60,000 s exchange time. b, HDX difference plots of SLC38A9NT in complex with inactive Rags and in isolation at 60 (left), 600 (middle) and 60,000 s (right) exchange time. Plotted are the mean +/ SD of technical replicates (n=3). c, Individual SLC38A9NT MS peptide spectra of selected peptides in isolation (black) and in complex with inactive Rags (red). Undeuterated reference spectra are shown at the top. Data for graphs in b are available as source data online.
