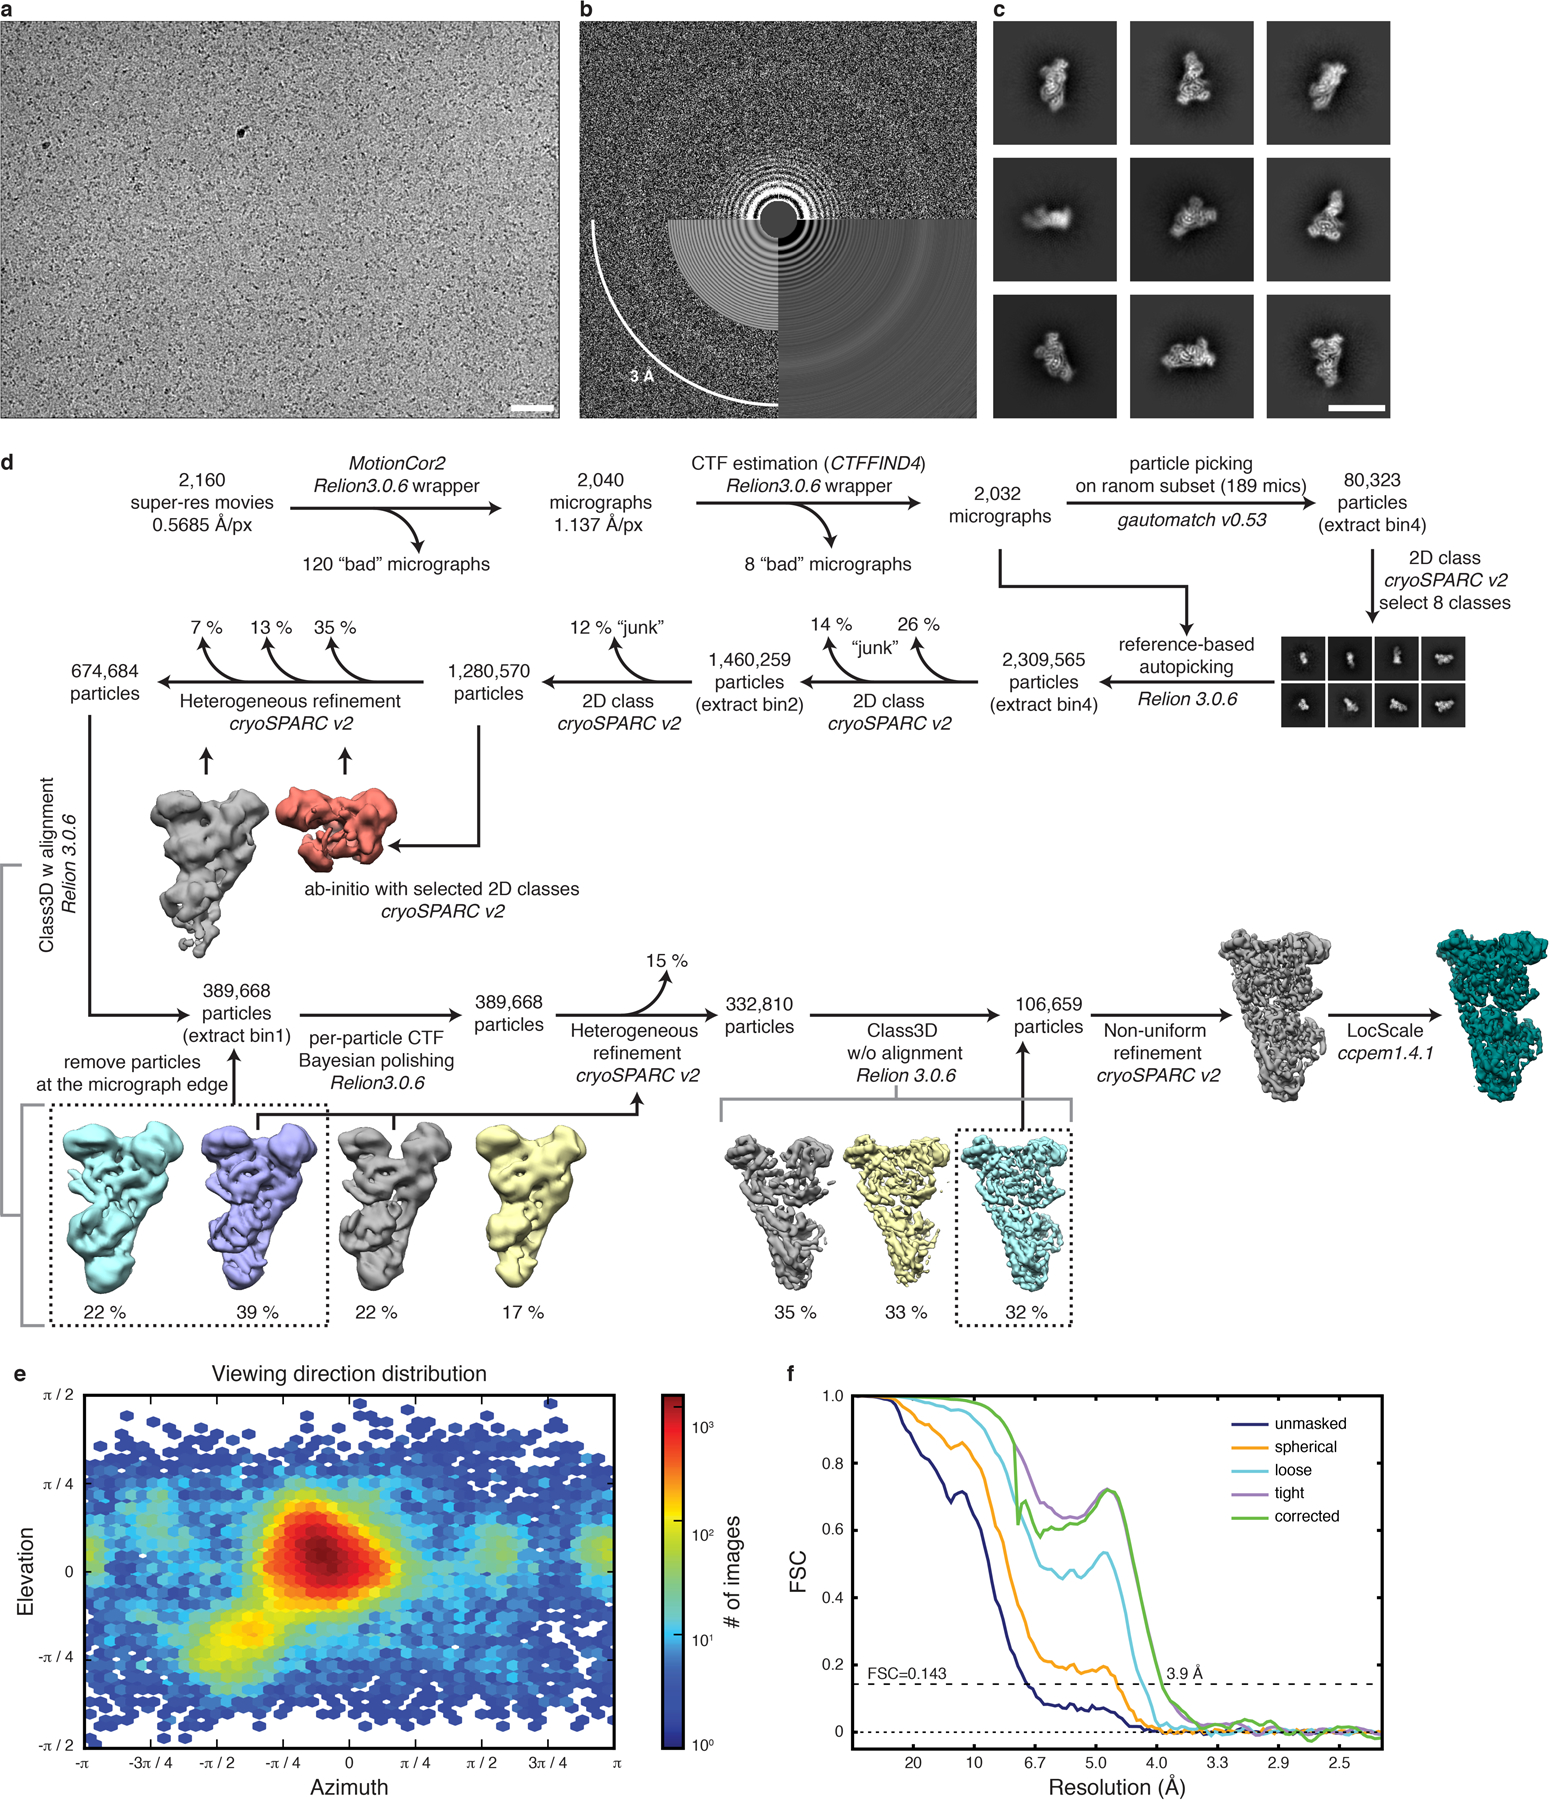
Extended Data Fig. 4. Post-GAP complex cryo-EM structure determination.

a, Exemplary raw cryo-EM micrograph at −2.2 m defocus. Scale bar 50 nm. b, Power spectrum of micrograph shown in a with CTF estimation. c, Exemplary 2D class averages. Scale bar 150 Å. d, Cryo-EM data processing workflow. Used software is indicated with italic font. e, Particle orientation distribution of the final particle set. f, Fourier shell correlation (FSC) of the final 3D reconstruction.
