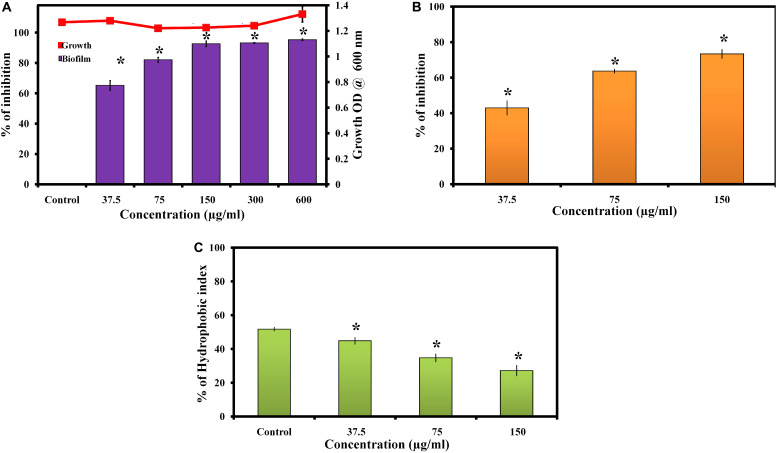
FIGURE 1.
(A) Effect of morin on growth and biofilm of C. albicans. Data are presented as means ± SD. *Indicates statistical significance (p < 0.05). (B) Inhibitory effect of morin on C. albicans exopolysaccharide production. Data are presented as means ± SD. *Indicates the statistical significance (p < 0.05). (C) Effect of morin on cell surface hydrophobicity of C. albicans. Data are presented as means ± SD. *Indicates statistical significance (p < 0.05).

