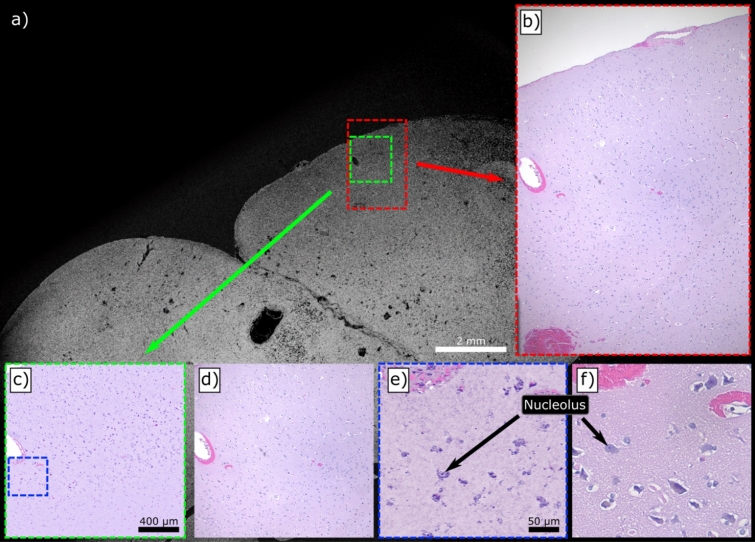
Figure 3.
Several comparisons between PARS and conventional bright-field images of FFPE slides of human brain tissues. (a) A wide field of view (WFOV) scan using 266 nm excitation with (b) a matching wide field image of the adjacent slide which has been H&E stained. (c) A two-color (250 nm and 420 nm) PARS with a false-colour map applied to match (d) the adjacent H&E region. Finally (e) and (f) likewise show a two-color PARS and bright-field image respectively in higher detail.

