
Extended Data Figure 4. Imaging genomic interactions in the extended Sox2 locus reveals frequent proximity of distal enhancer clusters and the target gene.
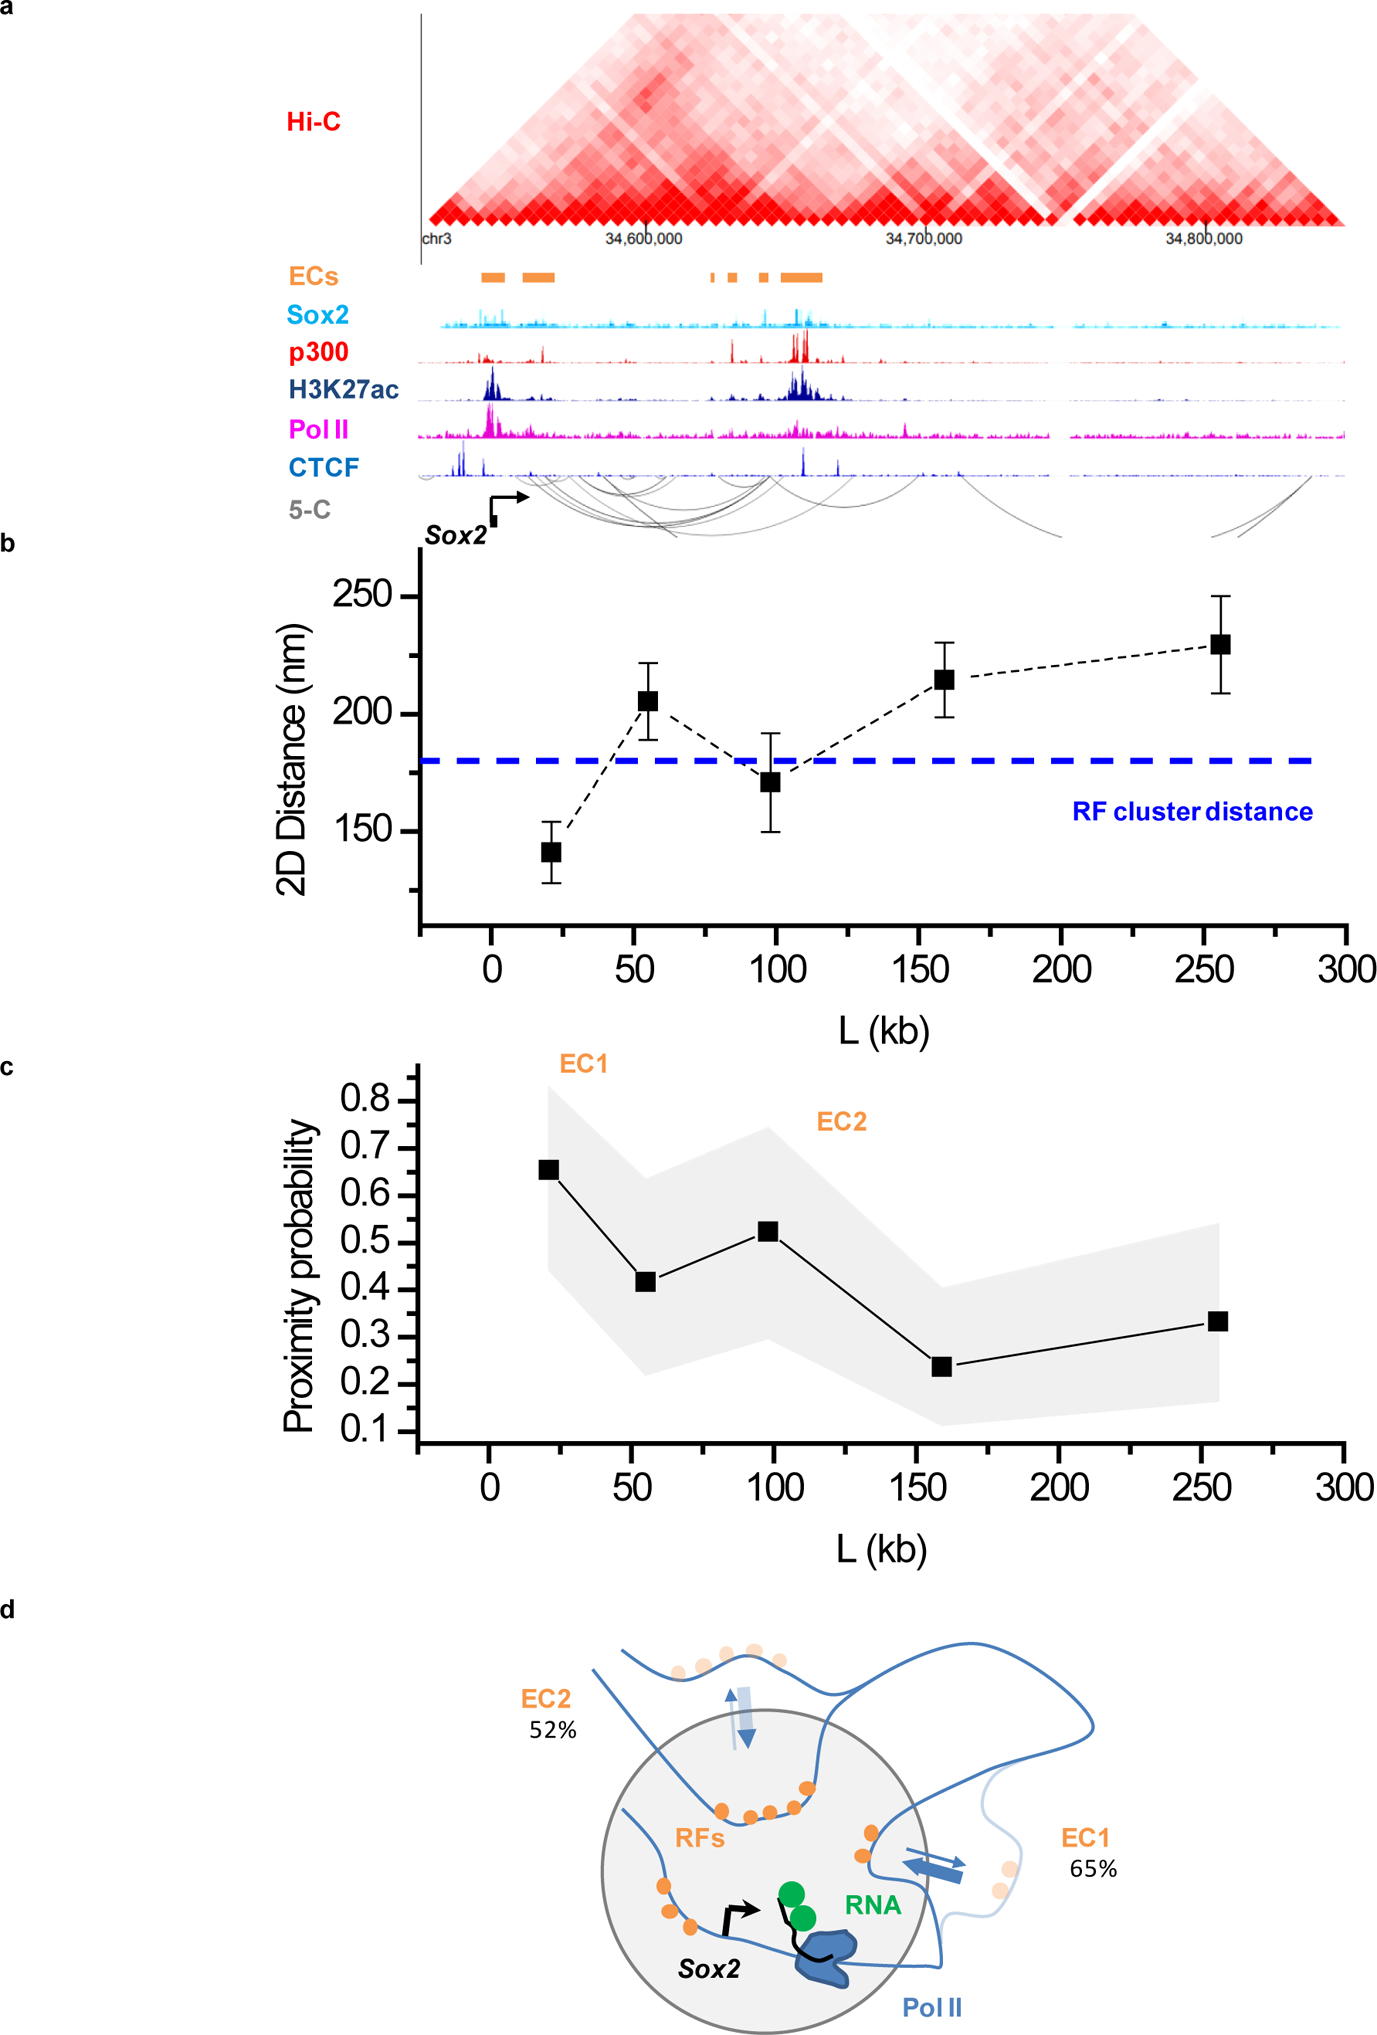
(a) Organization of the extended Sox2 locus from previously published proximity ligation (Hi-C, 5-C; accession numbers GSM2533818–21, GSM883649) and ChIP-Seq assays. ECs: enhancer clusters, characterized by presence of Sox2, p300 and H3K27ac ChIP signals. Accession numbers of ChIP-seq datasets used: GSM1910642, ENCFF001LJC, ENCFF001LJI, ENCFF001LIR, and ENCFF001KDN for Sox2, p300, Pol II, Ctcf, and H3K27ac, respectively. (b) Average distances and (c) proximity probabilities between the Sox2 transcription site (visualized with the 3’UTR MS2-tagged nascent RNA) and 5 regions between +20 kb and +300 kb from Sox2. (b) Data points: mean, error bars: S.E.M.. (c) Gray area: 95% binomial distribution confidence intervals. (b,c) Pooled data from 2 independent experiments with total n= 26, 24, 21, 38, and 27 individual transcription sites for the +21kb, +55kb, +98kb, +159kb, and +256kb genomic regions, respectively. In (b) Dashed line, indicates the 180 nm cutoff, corresponding to roughly the distance between RF clusters and the Pou5f1 transcription site. The 180nm distance cutoff is also used for the proximity probabilities shown in (c). (d) Cartoon of Sox2, highlighting frequent proximity of distal ECs to the Sox2 transcription site. Data for graphs in (b, c) are available as source data online.