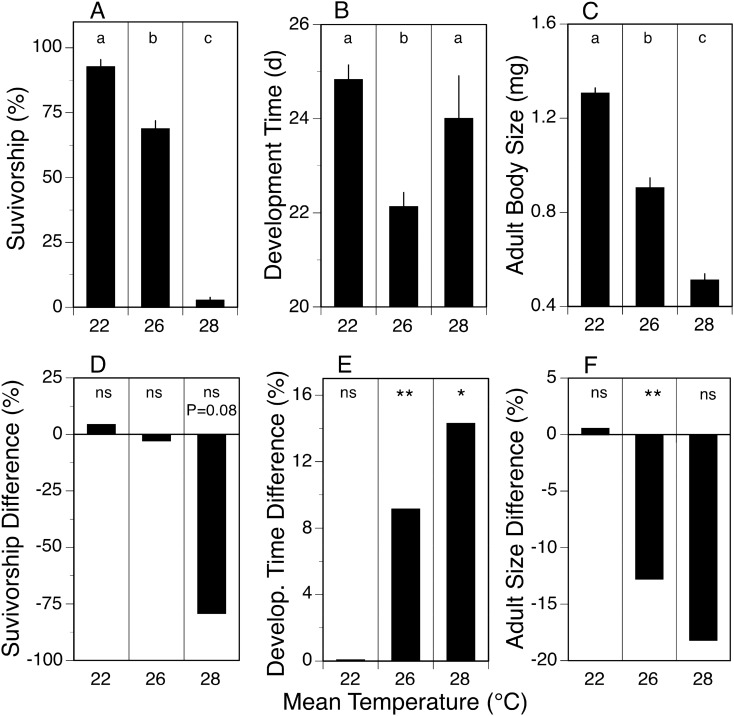
Figure 2.
Measures (mean ± 1SE) for survivorship (A), development time (B), and adult body size (dry weight) (C) across three variable temperature treatments (22, 26, and 28 °C). Each variable temperature treatment consisted of means from 4 replicate rearing jars, each containing 50 larvae. Statistically significant differences (1-way ANOVA with Tukey’s multiple comparison test, p ≤ 0.05) between variable treatments indicated by different letters over bars (a,b,c). Difference between constant and variable temperature treatments expressed as % difference (A–C relative to Fig. 1A–C) for survivorship (D), development time (E), and adult body size (F). Statistical significance (Student’s t-test) indicated by ns (p > 0.05), * (p ≤ 0.05) or ** (p ≤ 0.01).

