Figure 4.

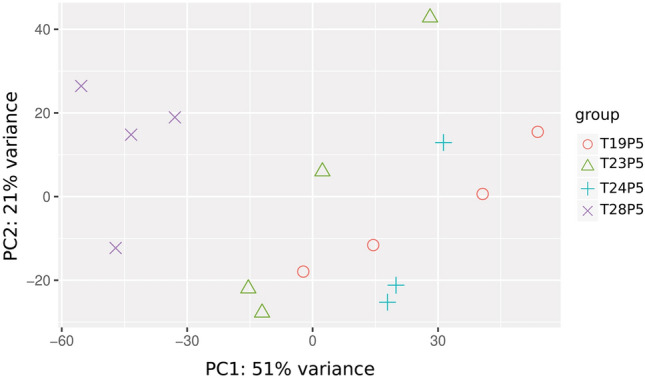
PCA plot showing similarity within Regimen 1 (19.5 and 24.5 °C) whereas the Regimen 2 shows strong effects of exposure to 28.5 °C. This transient 28.5 °C exposure appears to influence gene expression in the 23.5 °C group.

PCA plot showing similarity within Regimen 1 (19.5 and 24.5 °C) whereas the Regimen 2 shows strong effects of exposure to 28.5 °C. This transient 28.5 °C exposure appears to influence gene expression in the 23.5 °C group.