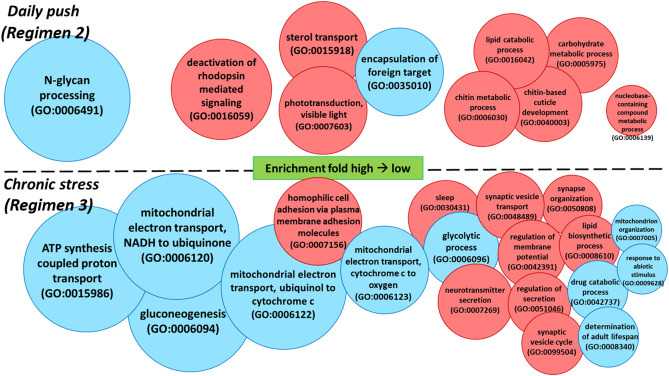
Figure 5.
Gene ontology (GO) enrichment analysis results showing GO enrichment analyses for biological processes affected in regimen 2 (top panel and C–D comparison from Fig. 3), and regimen 3 (bottom panel, B–C comparison from Fig. 3). Biological functions are represented as upregulated (red) and downregulated (blue) and are size scaled based on calculated fold enrichment of our differentially expressed genes dataset compared to drosophila database.

