
Extended Data Fig. 7: The ΔE-Xist-coated X-chromosome displays decreased DAPI staining and less compact H3K27me3-accumulation at differentiation day 7.
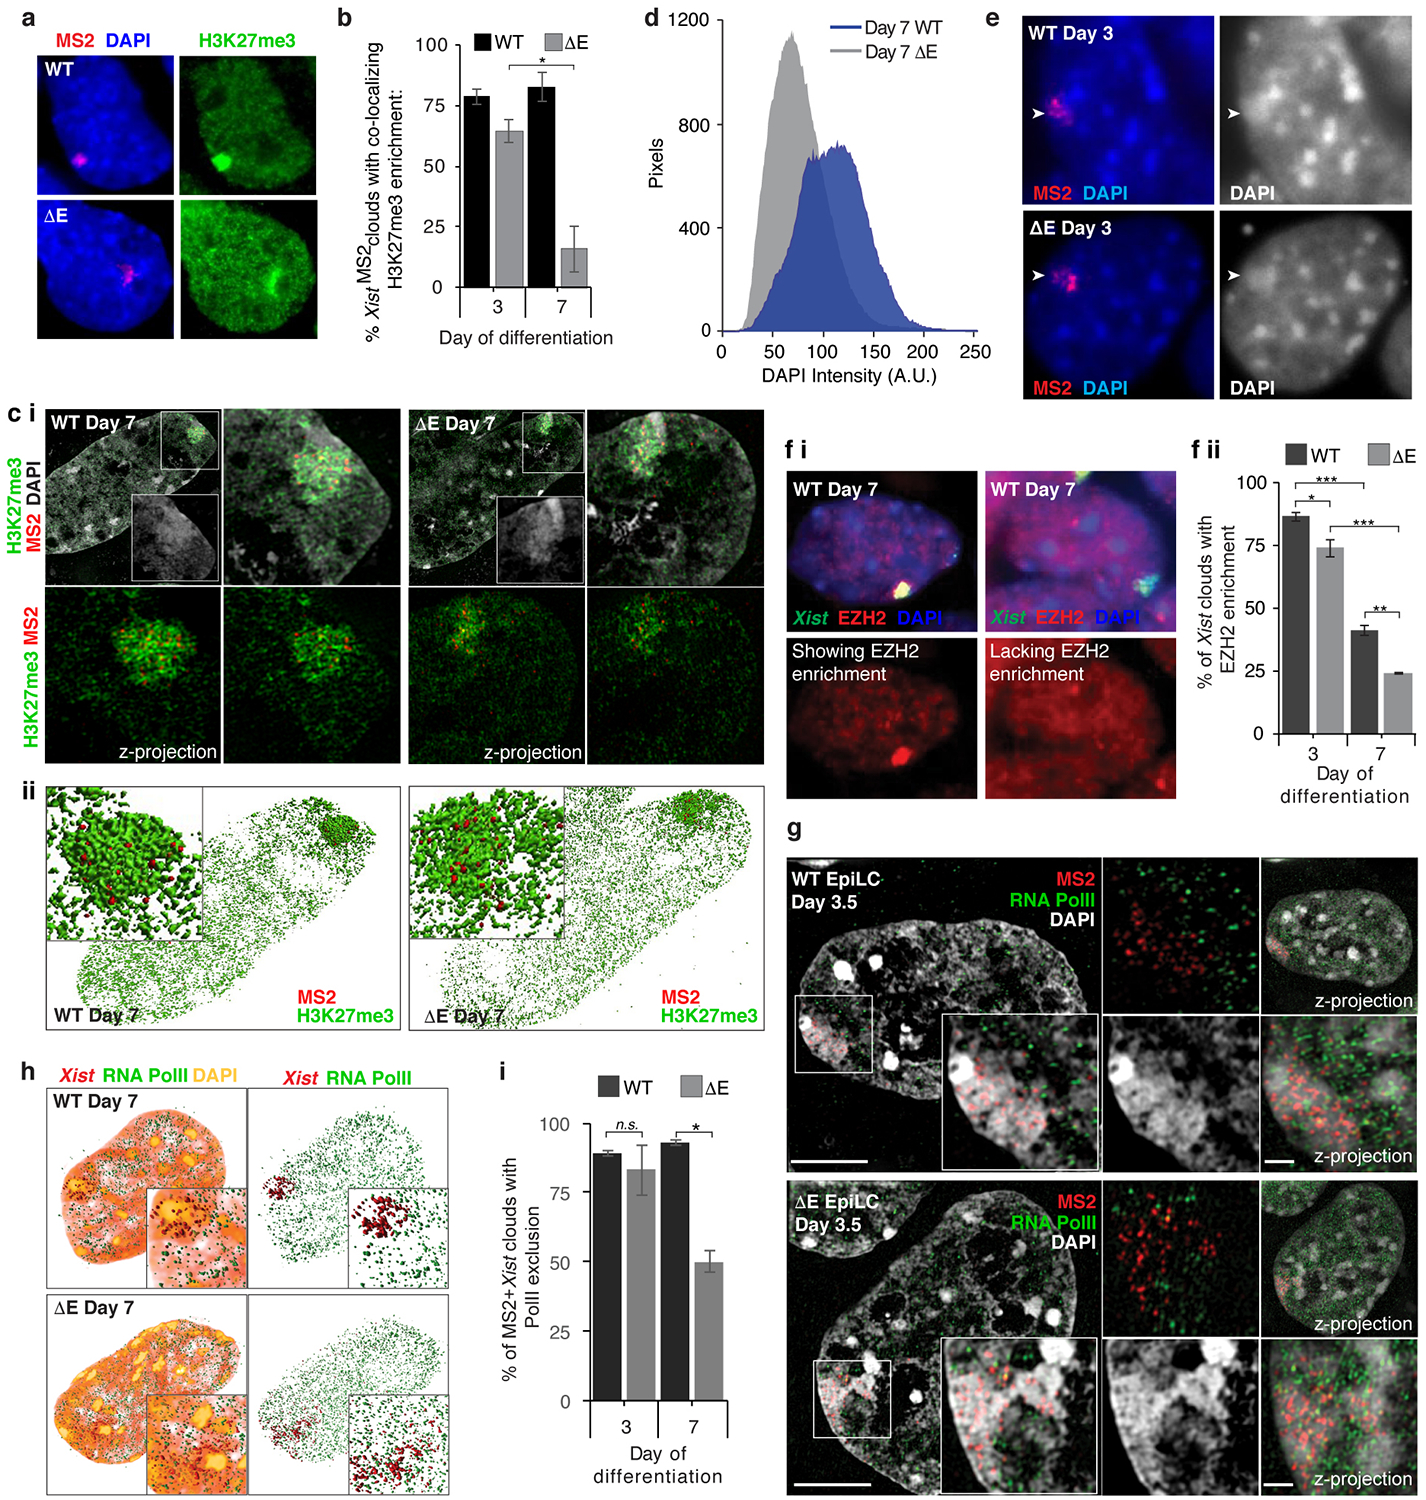
a, Epifluorescence images of cells immunostained for H3K27me3 and probed for MS2.
b, Quantification of MS2+Xist RNA FISH clouds with a co-localizing accumulation of H3K27me3 at day 3 or 7 of differentiation in WT or ΔE cells (n=60/coverslip, 3 coverslips over 2 experiments); *P = 0.05, 2-sample students t-test.
c i, Top left: 3D-SIM section of WT and ΔE cells at differentiation day 7 stained for H3K27me3 and DAPI and probed for MS2. Inset: DAPI staining of marked region. Right: Magnification of inset area with (top) or without DAPI (bottom). Bottom left: Z-stack projection of inset without DAPI. ii, 3D Amira reconstruction of images in (i).
d, Graph showing the number of pixels with indicated DAPI fluorescence intensity from MS2-Xist-expressing X-chromosome in WT and ΔE cells, masked by H3K27me3 enrichment (n=10, from one experiment).
e, Epifluorescence images of WT and ΔE cells probed for MS2. Arrowheads point to the Xist cloud and highlight the DAPI-bright staining for the X-territory.
f i, Epifluorescence images of WT cells stained for EZH2 and Xist, with (left) and without (right) EZH2 Xi-enrichment at differentiation day 7. ii, Histogram of the percentage of Xist clouds with co-localized EZH2 enrichment (n=60/coverslip, 3 coverslips from 2 experiments), *P <0.05, ** P < 0.005, ***P <0.0005, 2-sample students t-test.
g, 3D-SIM sections through day 3.5 differentiated WT or ΔE ESCs (EpiLC differentiation), immunostained for RNA PolII and probed for Xist, showing RNA PolII exclusion from the X-territory. Inset: Signals derived from marked area. Small images: top left: same as inset without DAPI; bottom left: same as inset only DAPI; top right: Z-stack projection of the cell; bottom right: Z-stack projection of the Xist-coated X. Scale bar: 5μm, Inset: 1μm.
h, 3D Amira reconstruction of cells in Fig. 2e. Inset: Enlargement of the MS2-Xist-expressing X. Right: Same as left without DAPI.
i, Quantification of RNA PolII exclusion from XistMS2-coated territory (n=50/coverslip, 2 coverslips from 1 experiment), *P=0.05, 2-tailed students t-test.