
Fig. 1: Tubulin acetylation facilitates nuclear rotation and SUN1 polarization.
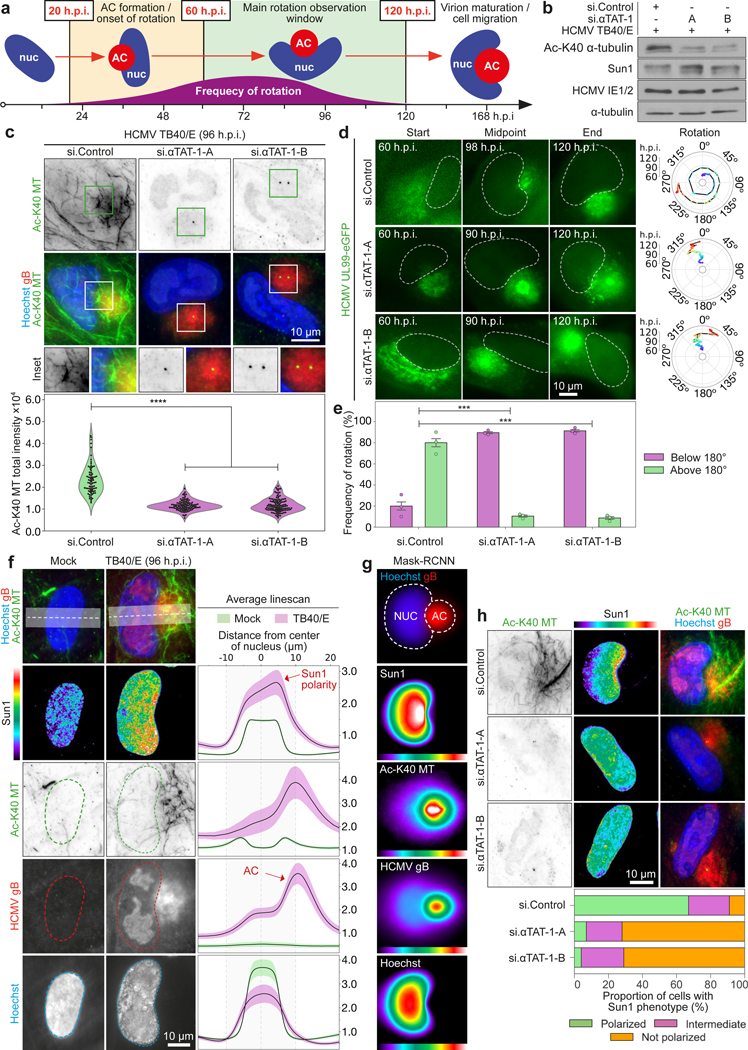
a, illustration of the HCMV AC (red) and nuclear (blue) rotation phase, highlighting primary imaging windows. b-c, Western blot and immunofluorescence showing αTAT1 depletion suppresses microtubule acetylation. Fluorescence intensity of acetylated microtubules was quantified; n = 303 cells total, ****p≤0.0001, two-tailed student’s t-test. All data points are shown within violin plots. Similar results yielded from 3 independent experiments. d-e, αTAT1 depletion suppresses nuclear rotation. Representative stills from Video 1 and rotational analyses are shown. Rotation frequency above or below 180° is shown in e; bars represent mean ± SEM; n = 309 cells total,***p≤0.001, two-tailed student’s t-test. f-g, Spatial distribution and intensity of DNA (hoescht), AC marker (gB), acetylated microtubules (Ac-K40-MT) and SUN1 using CNN (g) or DNA, gB and SUN1 using MASK-RCNN (h) analyses. Lines represent mean ± SEM; n = 34,712 cells total in dataset from 3 independent biological replicates for f; n = 2,214 cells total for g. h, αTAT1 depletion suppresses SUN1 polarization. For quantification, SUN1 was classed as polarized (green), intermediate (pink) or non-polarized (orange). n = 583 cells total. Similar results yielded from 3 independent experiments.