
Extended Data Fig. 2: Effects of HCMV infection on SUN1.
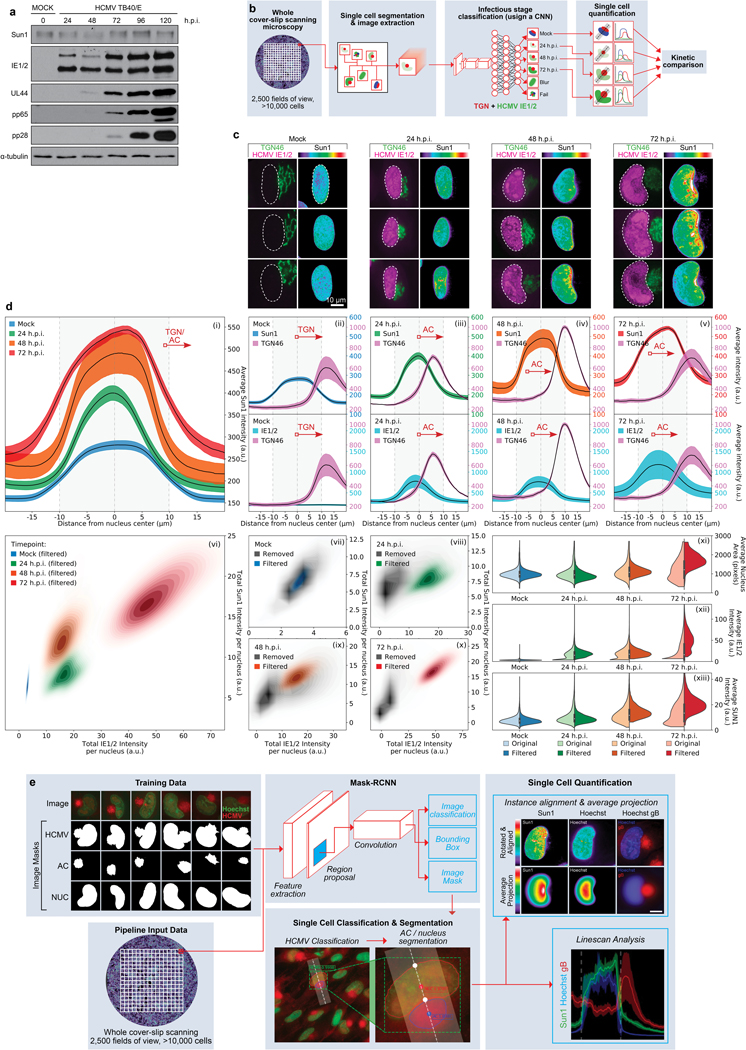
a, WB analysis of SUN1 levels over the course of infection with HCMV at MOI 1. Early (IE1/2), intermediate (UL44) and late (pp65, pp28) proteins demonstrate stages of infection at each timepoint, representative of 3 independent biological replicates. b-d, Neural network-based single cell analysis of SUN1 expression during HCMV infection. b, Illustration of CNN analysis pipeline that classifies cells by the predominant infectious cycle stage identified at each timepoint. c, Representative examples of uninfected NHDFs or NHDFs at various stages of infection, stained for SUN1, IE1/2 and TGN46. Expression of IE1/2 and gradual remodeling of the Golgi network serve as markers of infection stage. Polarization of SUN1 is seen between 24–72 h.p.i. d, CNN-based classification of cells based on IE1/2 expression levels, filtering out uninfected cells, reveals a gradual expansion of the nucleus and Golgi, characteristic of HCMV infection, occurs concomitantly with a gradual increase in expression and polarization of SUN1 toward the AC (i-v). Discrete populations of cells are filtered for inclusion in each timepoint (vii), with cells from other kinetic classes removed from analysis marked in grey (viii-x).Comparing unfiltered (lighter colored violin plots, left segment) versus filtered (dark colored violin plots, right segment) cell populations reveals the power of trained networks to more precisely analyze only infected cells within the population, more clearly revealing the increase in nuclear volume and SUN1 abundance, which peaks at approximately 2-fold (xi-xiii). Lines represent mean ± SEM; n = 37,800 cells total from 3 independent biological replicates. Violins as in Fig. 4a. e, Mask-RCNN analysis pipeline uses manually annotated masks of the AC, nucleus and combined (HCMV) to train a Mask-RCNN architecture to classify and segment microscopy images of HCMV infection. Once trained, whole cover-slip scanning datasets can be run through the model to perform instantaneous single cell quantification on high-confidence infected cells. This quantification has high spatial awareness and can be used to perform linescans between two specific subcellular compartments (e.g. the AC and nucleus) or to rotate and align nuclei to perform average projections (as in Fig. 1g).