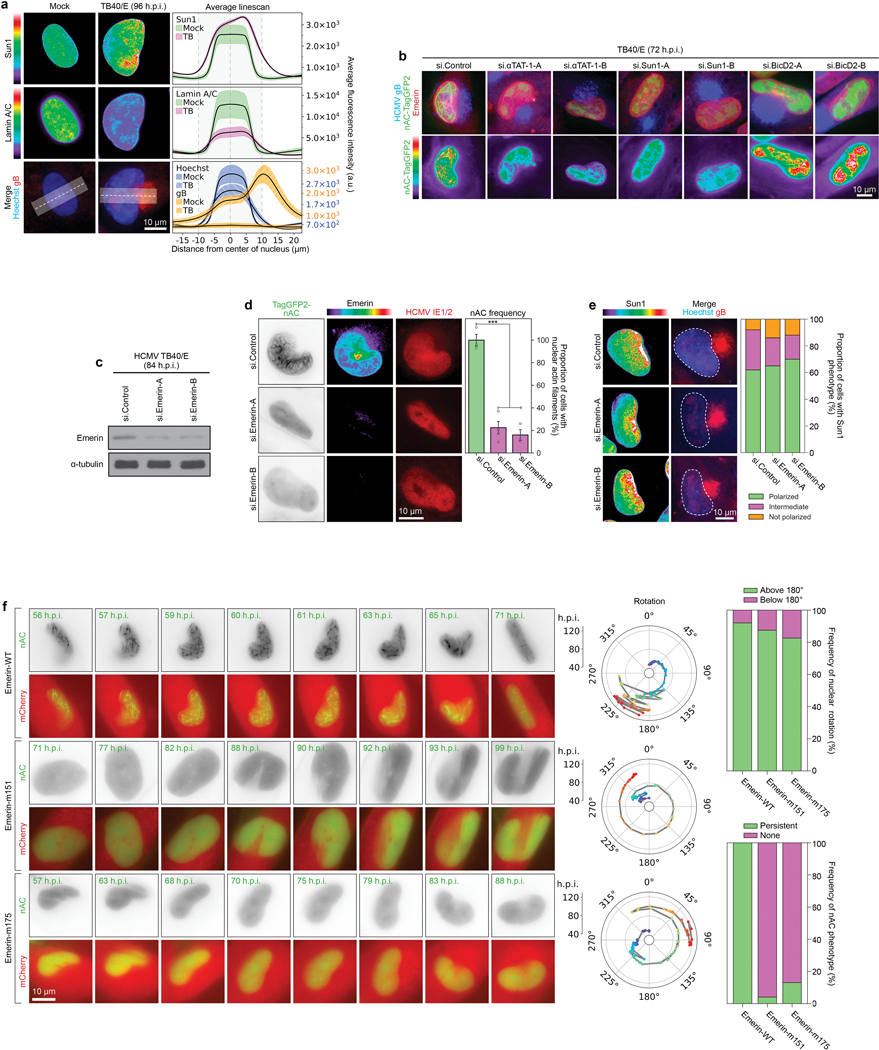
Extended Data Fig. 4: Microtubules and SUN1 regulate Emerin polarity and nuclear F-actin.

a, Lamin A/C is downregulated and lacks polarity in HCMV-infected cells. Lines represent mean ± SEM; n = 10,934 cells total from 3 independent biological replicates. b, Depletion of αTAT1, SUN1 or BICD2 inhibits Emerin polarization and causes aberrant F-actin networks. Representative images are shown for each condition, similar to data from 3 independent replicates. c-d, Emerin depletion blocks nuclear F-actin formation. c, WB analysis demonstrating the efficacy of Emerin siRNAs. d, Representative images and quantification of nuclear F-actin (nAC) frequency are shown for each condition, bars represent mean ± SEM, statistics use two-tailed student’s t-test, n = 401 cells total from 3 independent biological replicates, ***p≤0.001. Fluorescence intensity shows Emerin depletion in cells. e, Emerin depletion does not affect SUN1 polarization. Representative images and quantification of SUN1 polarization is shown for each condition; n = 321 cells. SUN1 was characterized as polarized, intermediate polarity or not polarized. f, Expression of actin-binding mutants of Emerin blocks nuclear F-actin formation but not nuclear rotation. NHDFs expressing nAC-TagGFP and mCherry-Emerin wildtype or actin-binding mutants (m151, m175) were infected with HCMV UL99-mCherry. Representative still images and rotation traces from time lapse imaging are shown. Quantification of nuclear rotation frequencies above or below 180° are shown for each condition; the presence of nuclear F-actin was also quantified in the same time lapse images, n = 72 cells total (upper) and n = 79 cells total (lower). Note that in order to image nAC-TagGFP cells were infected with HCMV UL99-mCherry. As such, mCherry signal in these images originates from both mCherry-Emerin and the viral UL99-mCherry, showing the cytoplasmic AC and nuclear rotation in infected cells under all conditions. Data shown is representative of 3 independent replicates.
