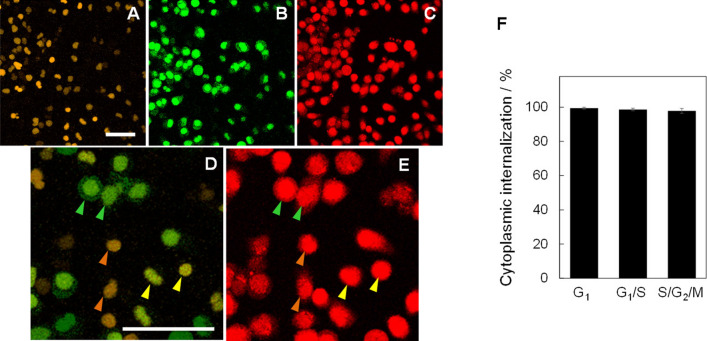
Figure 2.
Efficient internalization of TatBim-PS by HeLa/Fucci2 cells irrespective of cell-cycle phase. (A–C) Fluorescence images of the mCherry–human Cdt1 fusion protein (mCherry–hCdt1) showing G1 and G1/S transition phases (A), mVenus–human Geminine fusion protein (mVenus–hGem) showing S/G2/M phase (B), and TatBim-PS (C). The fluorescence of mCherry (emission maximum around 610 nm) was pseudo-colored as orange to distinguish it from the red fluorescence of TatBim-PS (PS = Alexa633; emission maximum at around 650 nm). Scale bar, 50 µm. (D) Magnified, merged image of A and B. Green arrows: S/G2/M, Orange arrows: G1, and, Yellow arrows: G1/S transition. Scale bar, 50 µm. (E) Magnified image of C. The arrows indicate the same cell cycle phases as in D, with identical color scheme. (F) Cytoplasmic internalization efficiency at each cell-cycle. Data are shown as the mean ± SEM (n = 3; each of the analyzed areas included 117 cells on average).

