
Fig. 1:
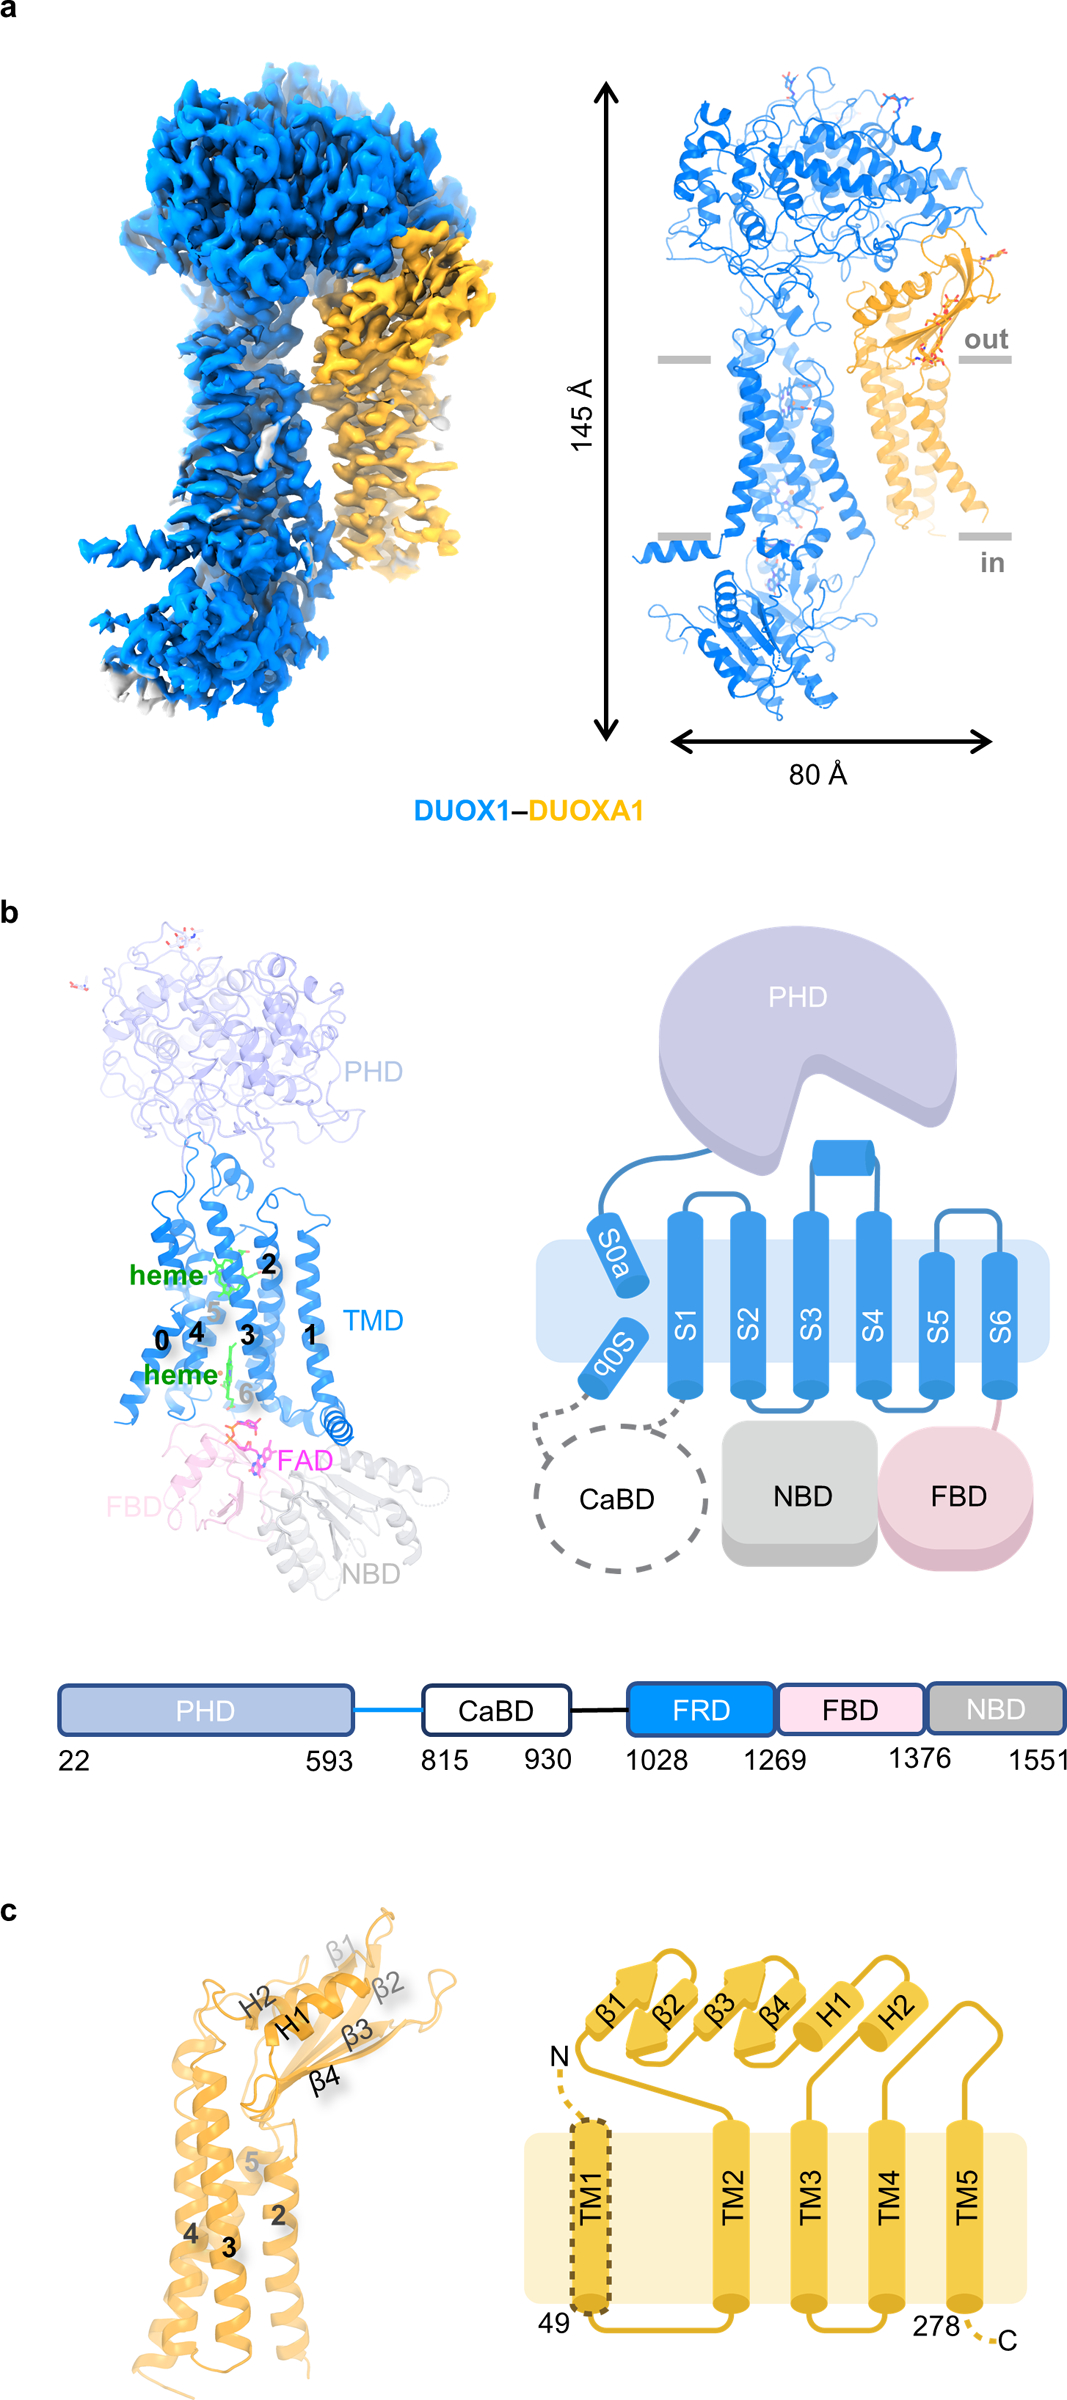
Structure of DUOX1–DUOXA1 in the absence of NADPH. a, Cryo-EM map and structural model of the DUOX1–DUOXA1 complex. DUOX1 and DUOXA1 are colored in blue and orange, respectively (the same color code will be used unless otherwise noted). The membrane boundary is indicated using grey lines. b, Top: structure and cartoon model of DUOX1. The PHD, TMD, FBD and NBD of DUOX1 are colored in light blue, blue, pink and grey, respectively. The CaBD is indicated by a dashed cycle. FAD and hemes are shown as sticks and colored in magenta and green, respectively. Bottom: the scheme of DUOX1 with domain boundaries shown. FRD stands for and ferric oxidoreductase domain (S1–S6 of DUOX1). c, Structure of DUOXA1. The secondary structures between TM2 and TM3 are labeled with β1–4 and H1–2.