
Fig. 3:
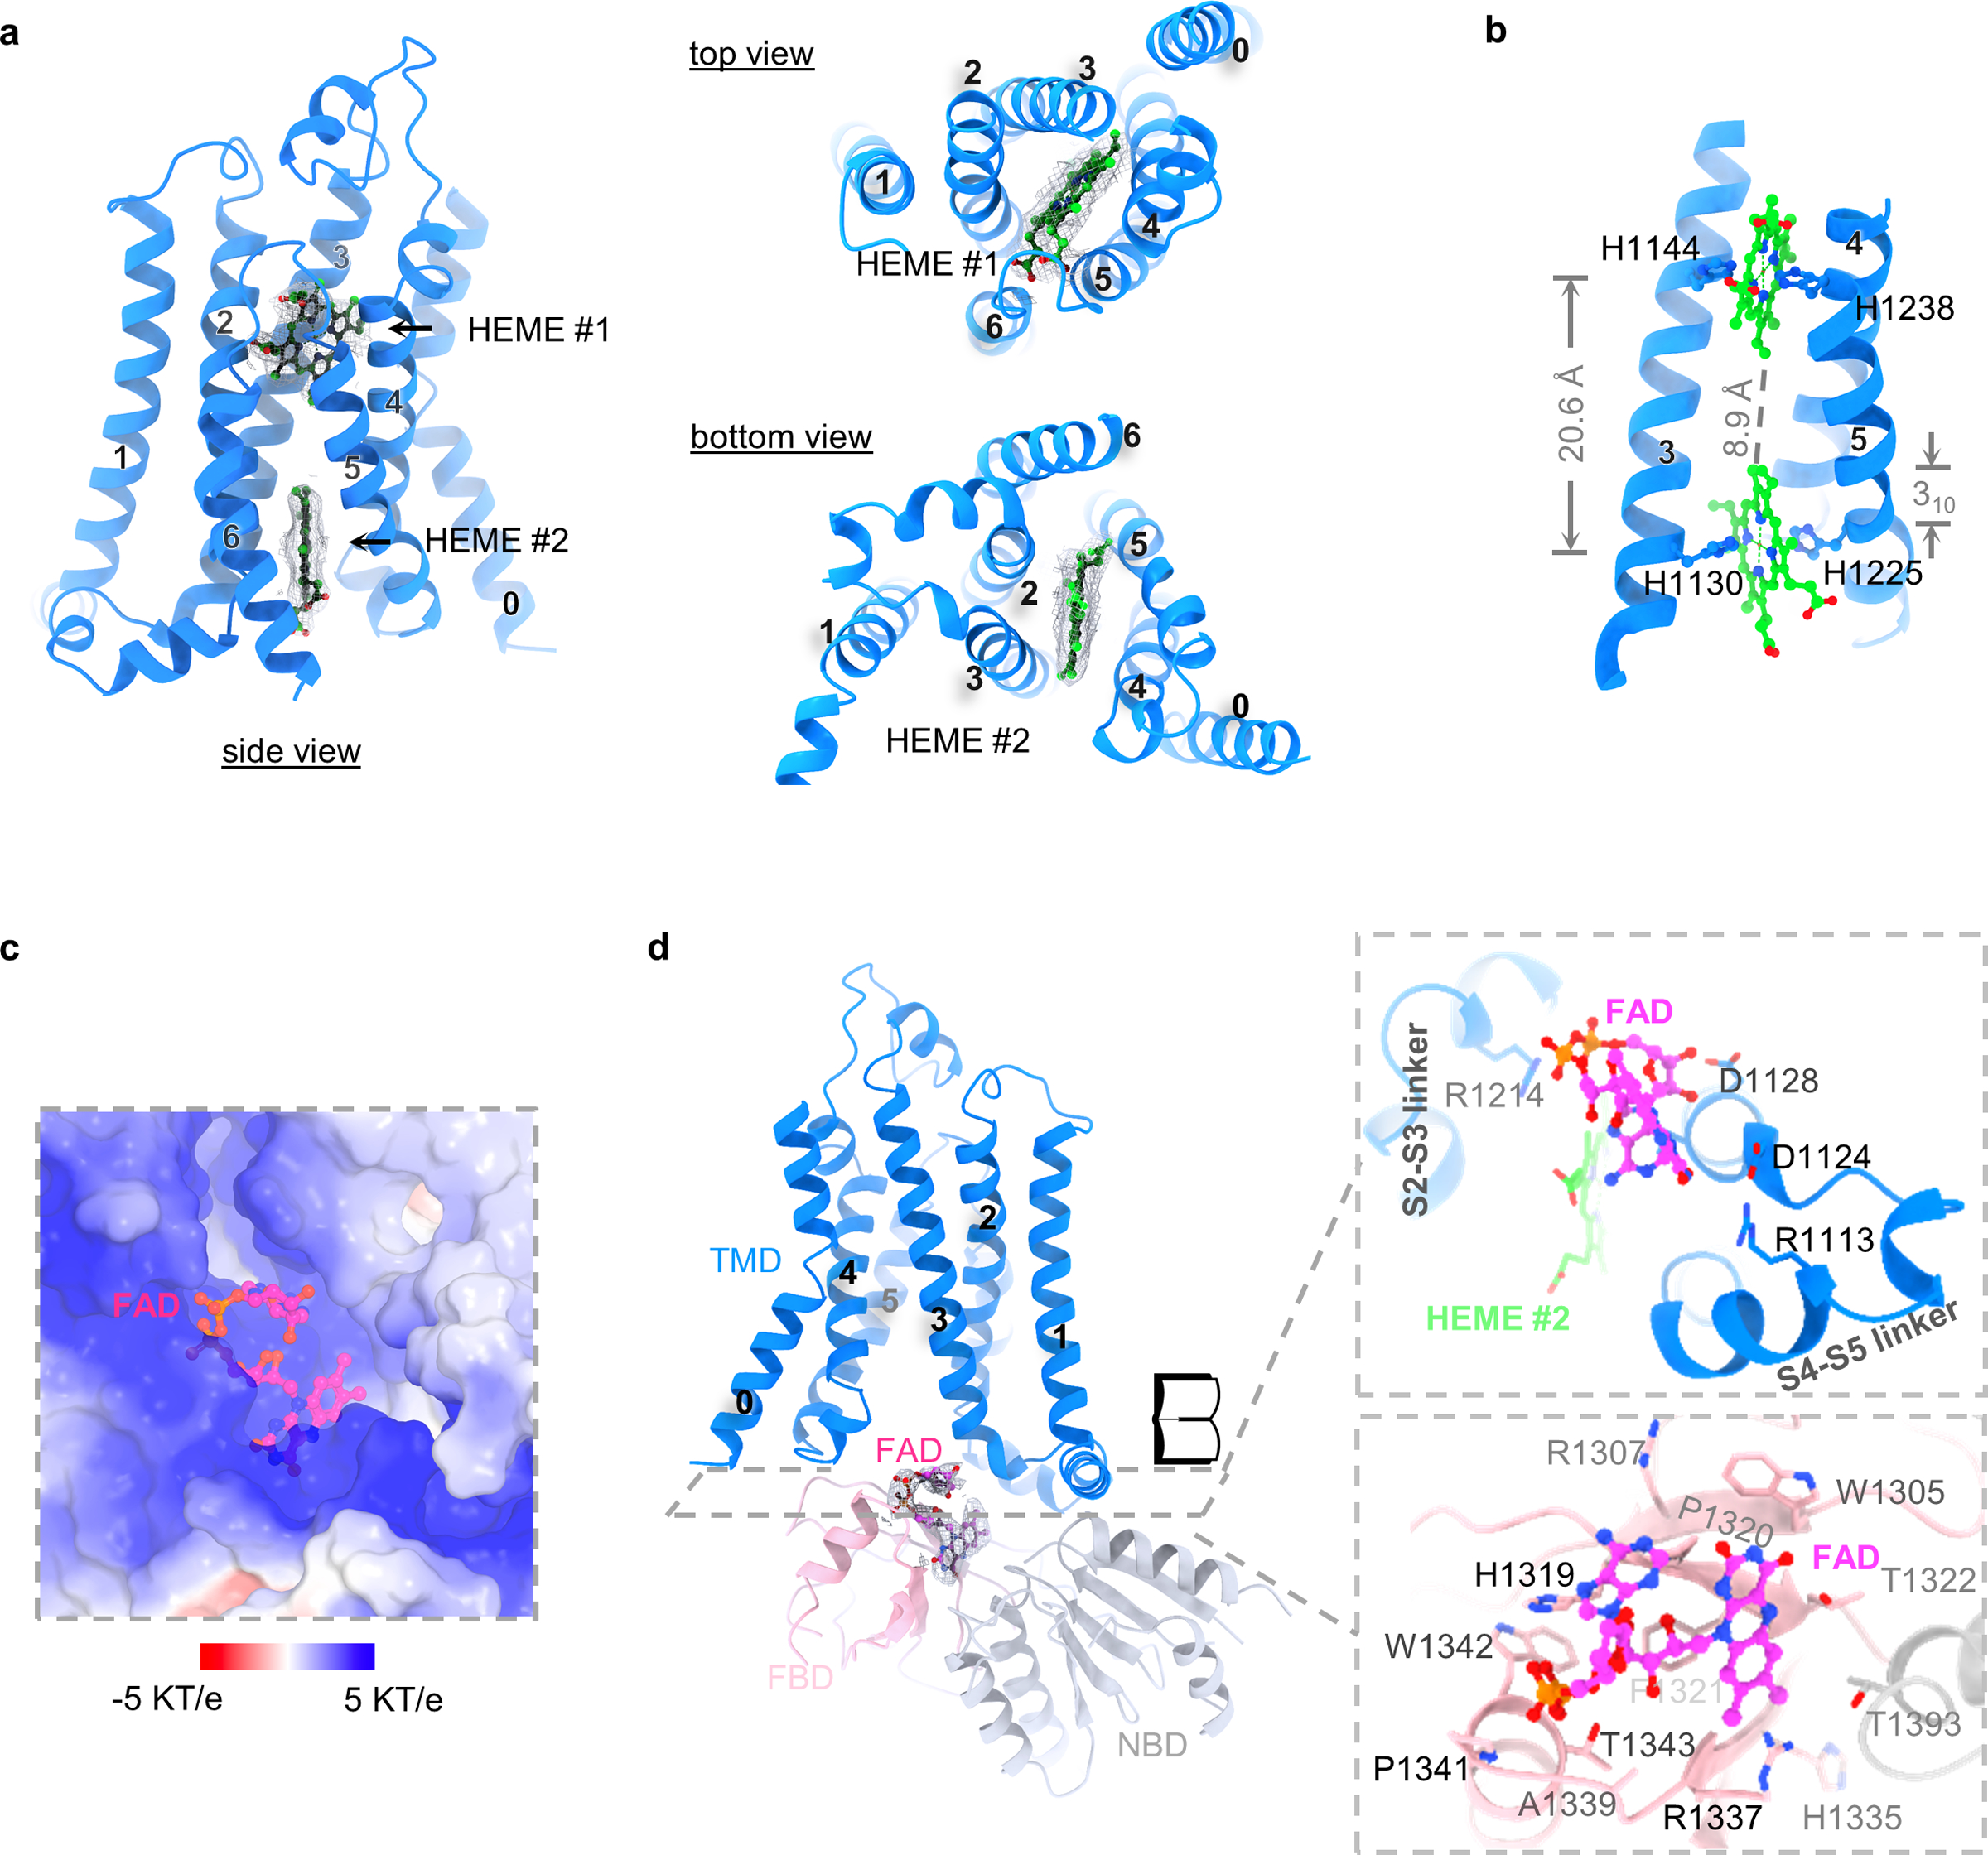
Heme- and FAD-binding sites. a, Densities of two heme groups from three different views. Heme groups are colored in green, densities in grey. b, Coordination of heme groups. Sidechains of histidines that are involved in ion coordination are shown. The distance between Fe ions as well as the 310 helix is indicated. c, The positively charged FAD-binding pocket. FAD is colored in magenta. The surface potential (-5 KT/e to 5 KT/e) is calculated using APBS plugin in PyMOL35. d, FAD-binding site. The density of FAD is shown and colored in grey. The open book view of the FAD-binding pocket is shown. TMD, FBD and NBD are colored in blue, light pink and grey, respectively.