
Fig. 6:
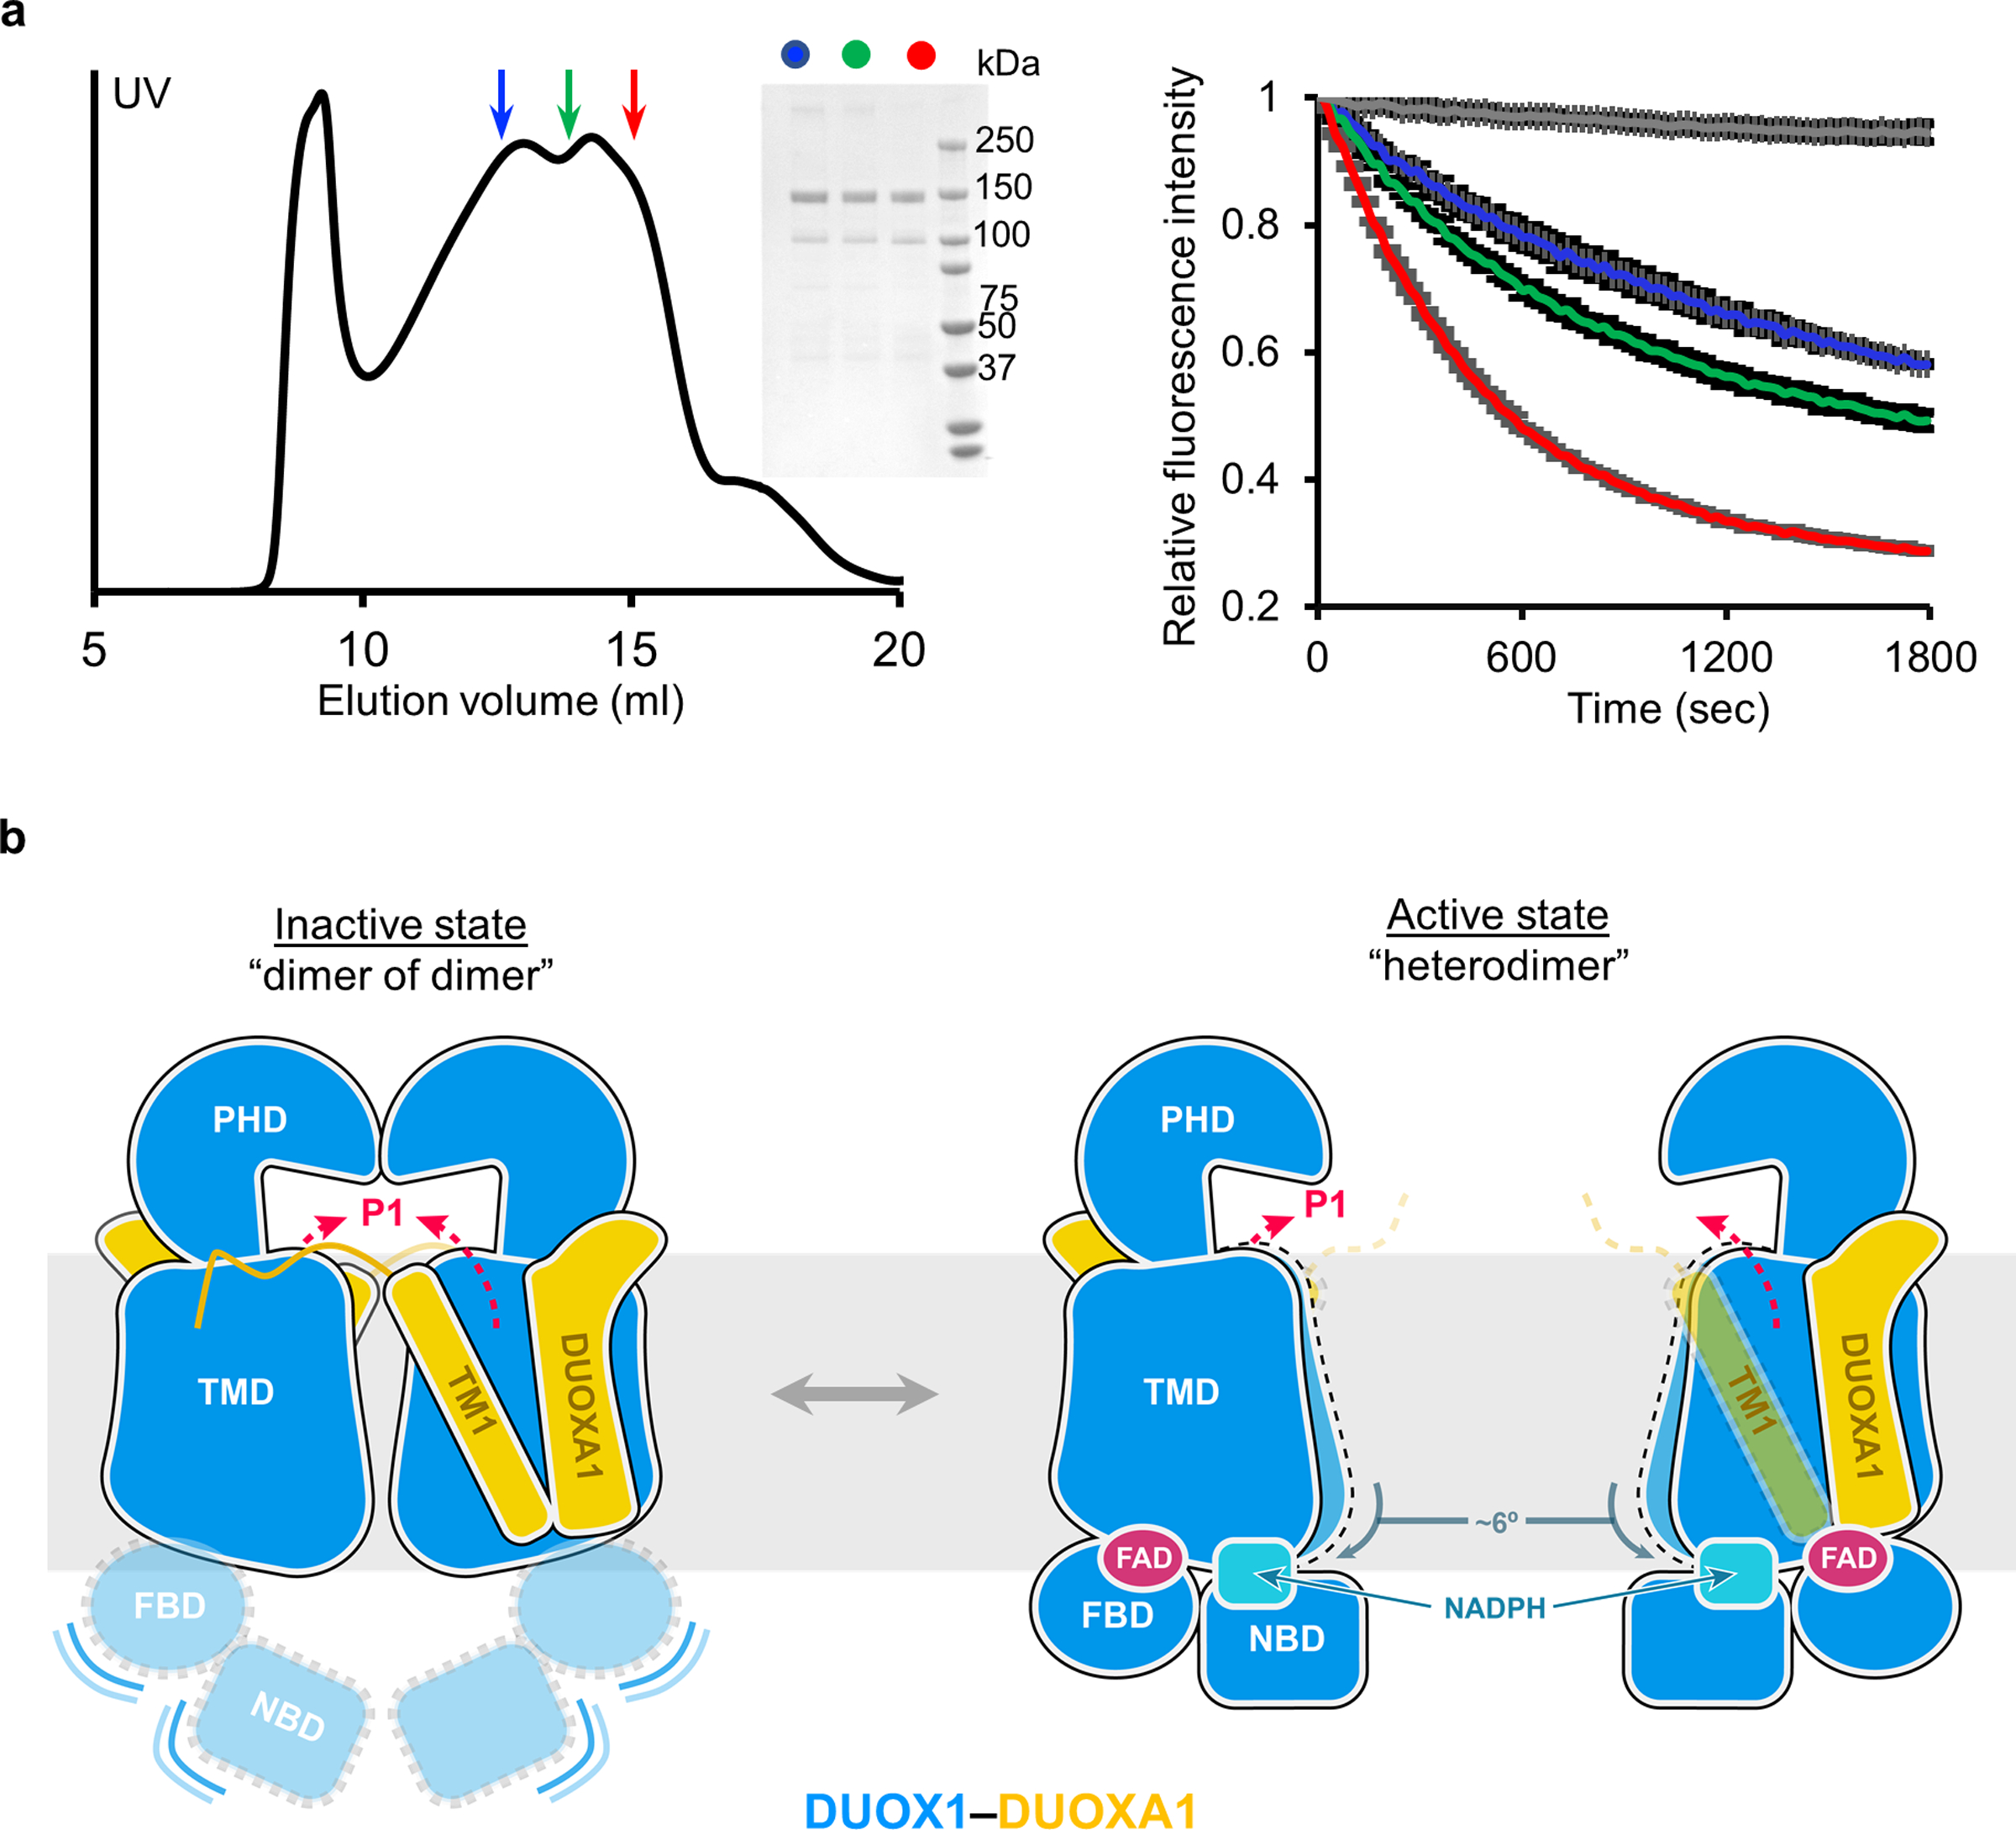
The dimer-of-dimer conformation of DUOX1–DUOXA1 represents an inactivated state. a, The activity of DUOX1–DUOXA1 from different fractions of size exclusion chromatography. Left: size exclusion chromatography of the DUOX1–DUOXA1 complex. Fractions taken for activity assay are indicated by arrows colored in blue, green and red, respectively. Middle: SDS-PAGE of the fractions taken from the left panel. Right: activity of the fractions from the left panel (same color code). The grey trace is the negative control. b, A model suggesting activation of DUOX1–DUOXA1 from dimer-of-dimer state to heterodimer state. DUOXA1 is not shown for clarity. The PHD, TMD, FBD and NBD of DUOX1 are colored in blue and shown using different shapes. DUOXA1 is colored in orange, and its N-terminal loop and TM1 are shown. Red dashed arrows indicate the oxygen entering or hydrogen peroxide exiting path (P1 in Fig. 4d).