
Extended Data Fig. 1. Structure determination of the DUOX1–DUOXA1 complex.
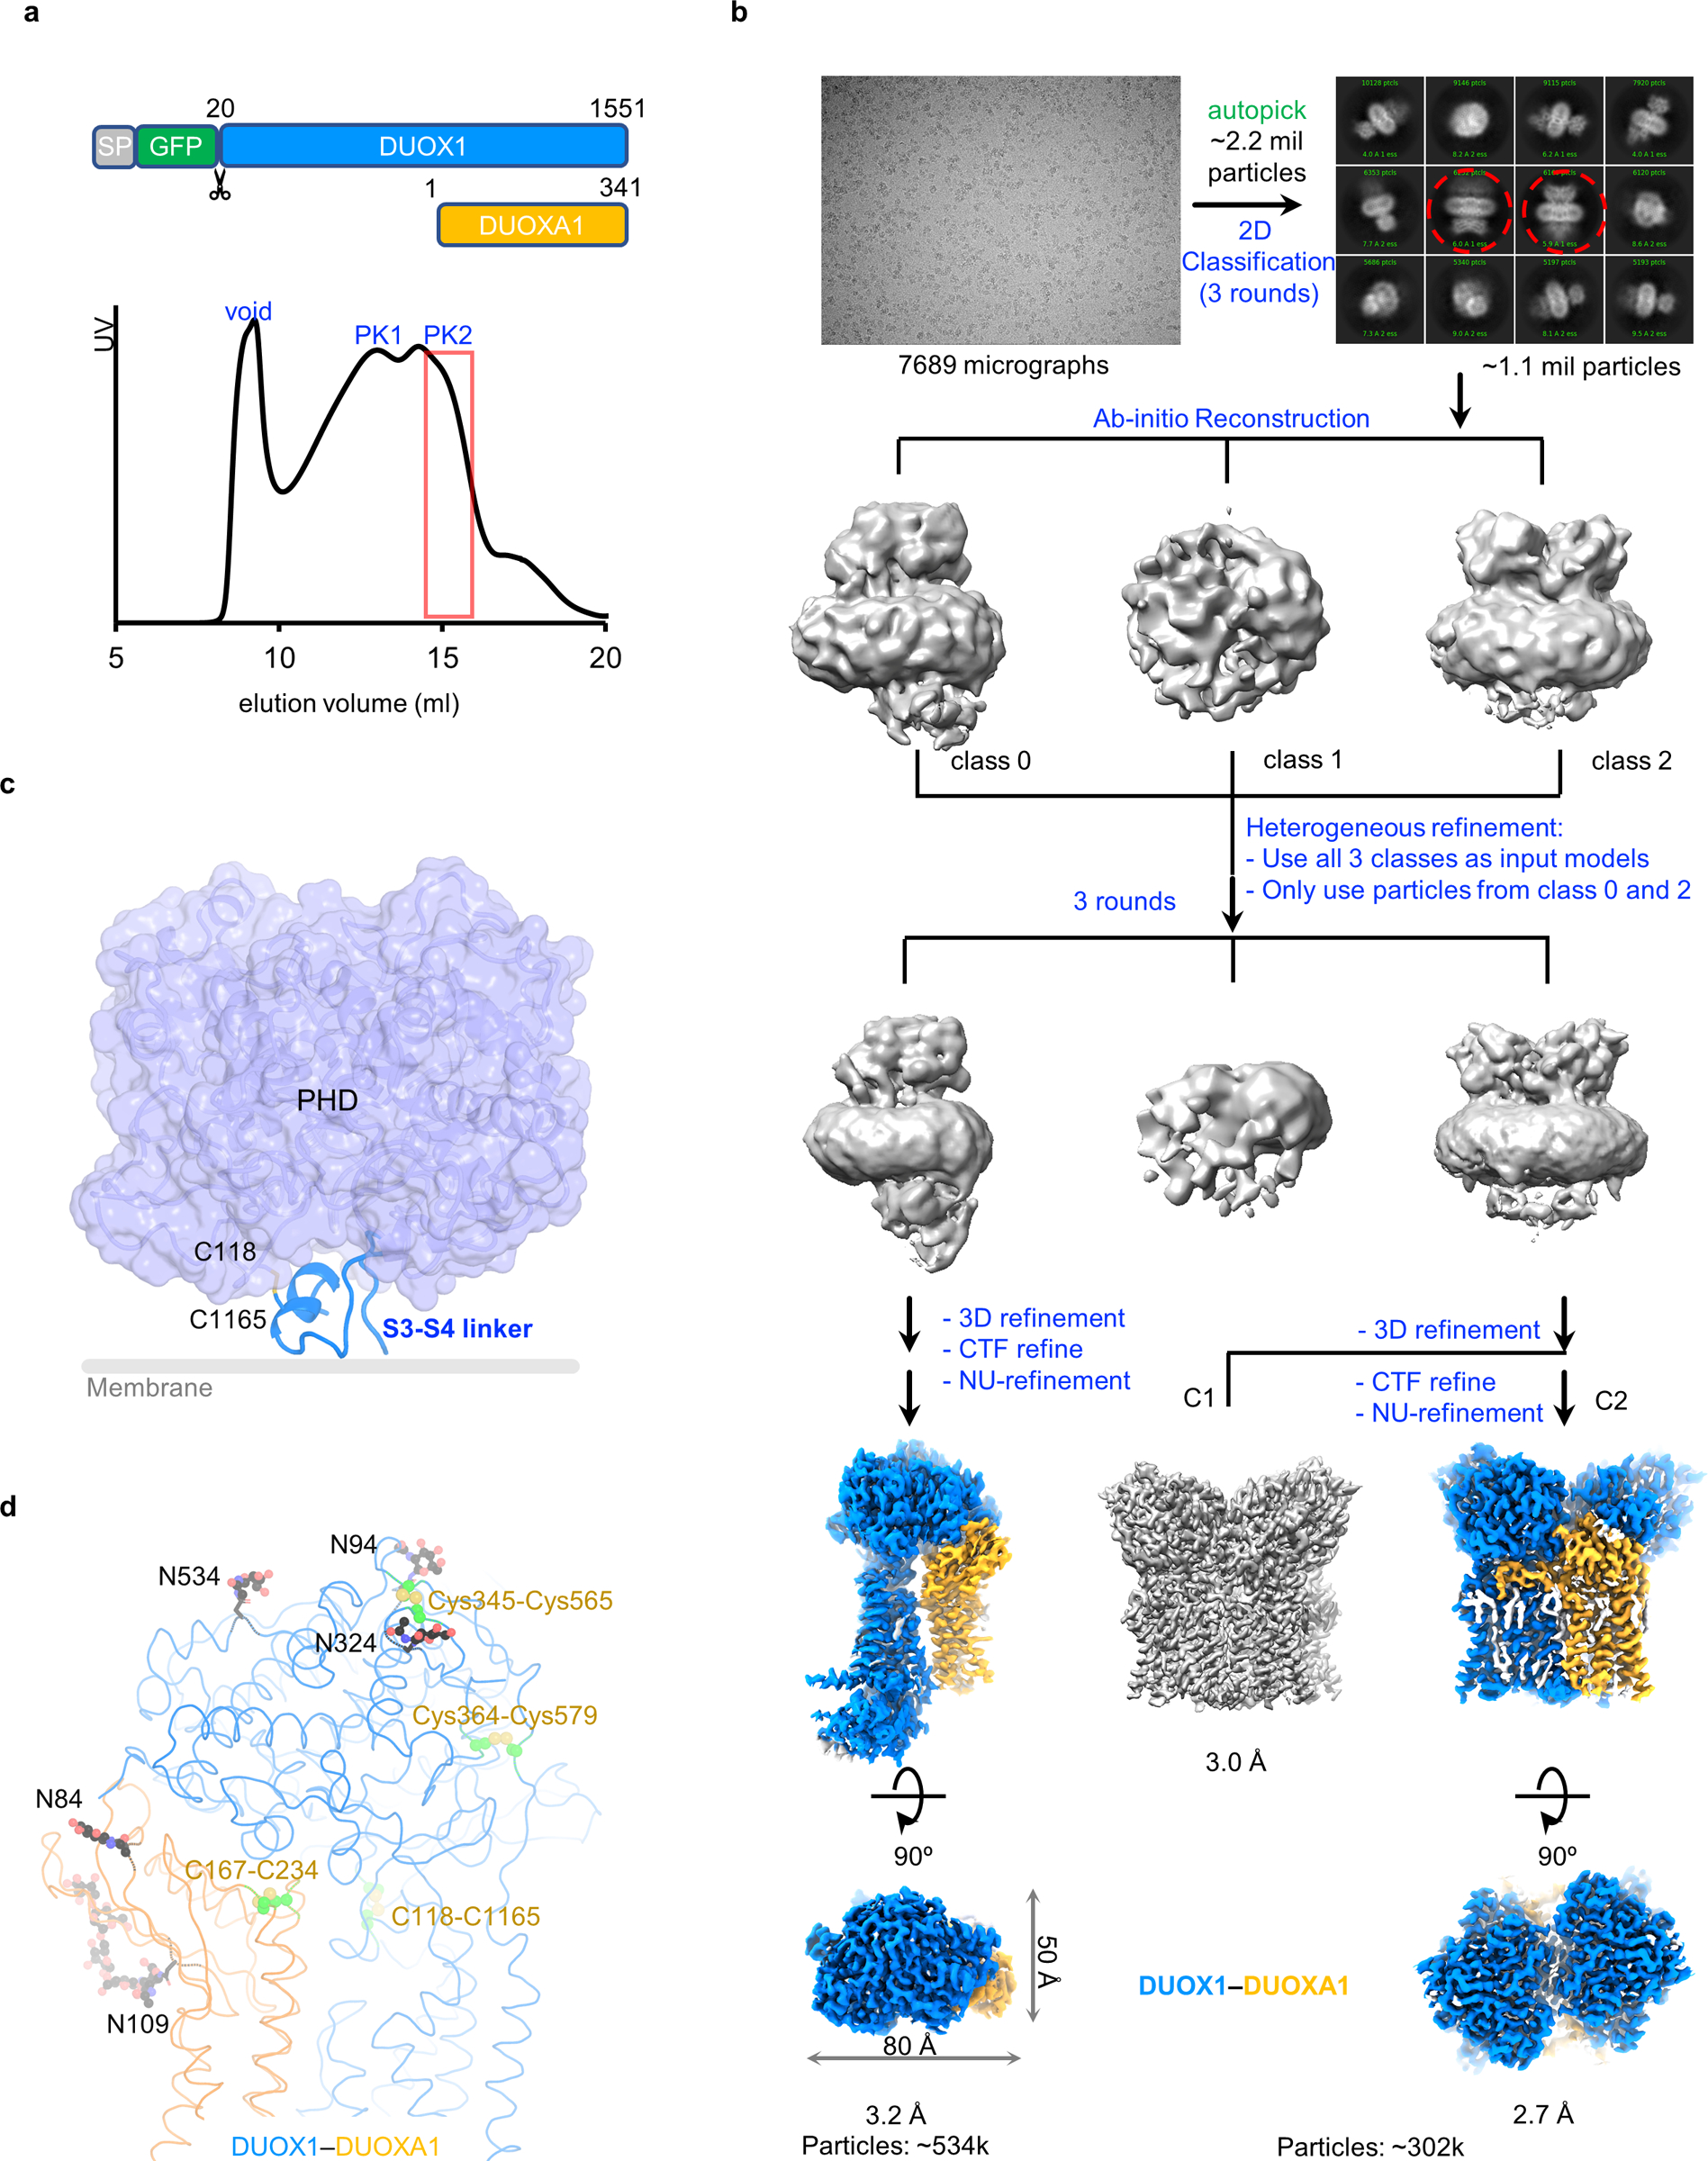
a, Construct design of DUOX1 and DUOXA1 used for structural studies and size exclusion chromatography profile of the DUOX1–DUOXA1 complex. Fractions of second peak (PK2) in the red box are concentrated and used for single-particle analysis. b, Flowchart of DUOX1–DUOXA1 structure determination. The steps in blue are carried out in cryoSPARC, ones in green in RELION. In the 2D classification, dimer-of-dimer classes are indicated by red dashed cycles. c, Interaction between the S3–S4 linker and PHD of DUOX1. The out leaflet of the membrane bilayer is indicated by a grey line. d, Disulfide bonds and glycosylation sites of the DUOX1–DUOXA1 complex. Sugars and their linked Asn side chains are shown as sticks and balls. Disulfide bonds are colored in green.