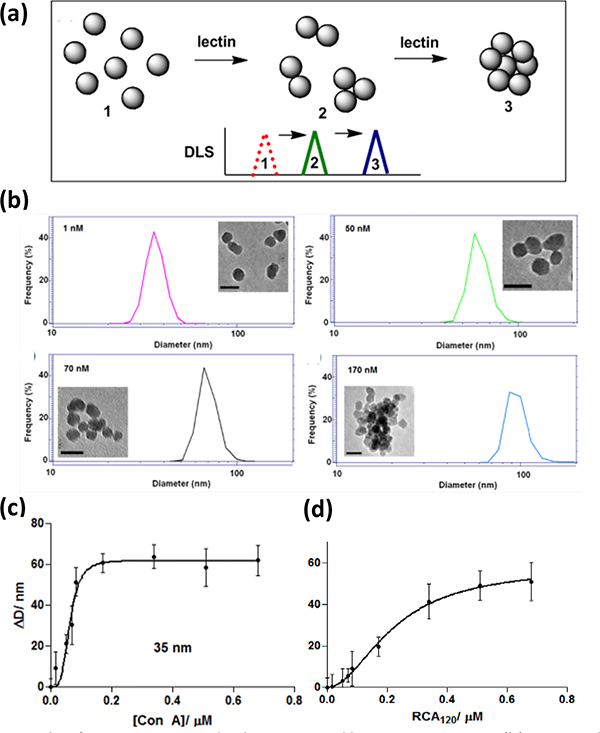
Fig. 10.
(a) Principle of using DLS to study glyco-NPs and lectin interactions. (b) DLS graphs and TEM images (scale bars: 50 nm) of Man-SNPs treated with varying concentrations of Con A. (c) Increase in particle size (ΔD) of Man-SNPs after adding varying concentration of Con A. (d) Increase in particle size (ΔD) of Gal-SNPs after adding varying concentration of RCA120. In (c) and (d), the circles were experimental data and lines were the Hill fitting curves. Reproduced from ref. 81 with permission from The Royal Society of Chemistry, copyright, 2011.

