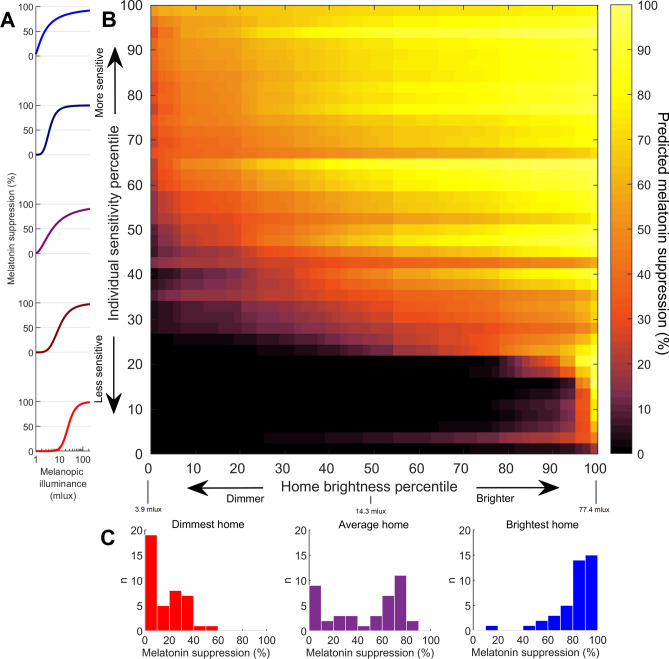
Figure 2.
Home lighting in the context of circadian light sensitivity. Using individual-level dose-response curves for light (A) in combination with home light recordings, we predicted melatonin suppression in each home across the range of individual sensitivity levels (B), with rows sorted by number of homes with > 25% suppression. Predicted responses across individuals are shown as histograms (C) for the dimmest home, average home (median brightness), and brightest home.

