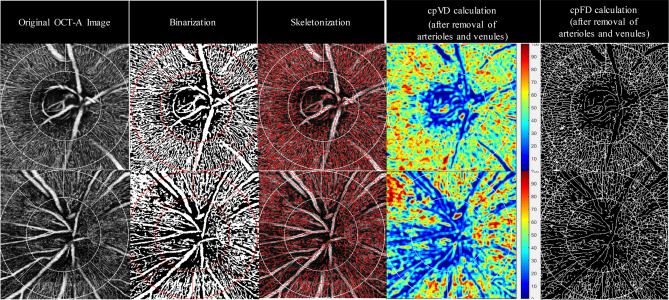
Figure 2.
Quantification of OCT-A Capillary Metrics in Normal and NTG eyes. Measurement of OCT-A capillary metrics are generated from ONH OCT-A images by a semi-automated customized MATLAB program (MATLAB R2017a, The MathWorks, Natick, MA, USA. https://www.mathworks.com/products/matlab.html). (From left to right) ONH OCT-A images with the cpVD and cpFD measurement region defined. Binarization of the ONH OCT-A images with white pixels representing the blood vessels and black pixels representing the background (non-perfusion regions). Skeletonization of the ONH OCT-A images. Analysis and quantification of cpVD after removal of retinal arterioles and venules from the binarized ONH OCT-A images. Analysis and quantification of cpFD after removal of retinal arterioles and venules from the skeletonized ONH-OCT-A images. (Top: an example of normal eye. Bottom: an example of NTG eye).

