Figure 6.
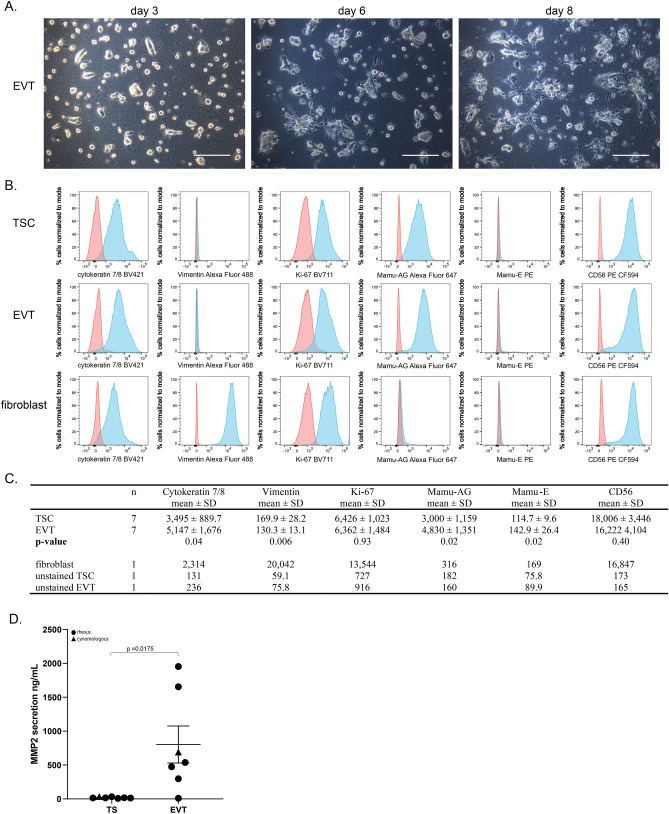
TSCs differentiate to an EVT-like cell type. (A) Morphology representative of EVTs derived from rh121119 TSCs on day 3, 6 and 8 of culture. Scale bar denotes 250 µM. (B) Representative flow cytometry histograms for TSCs, EVTs and rhesus fetal fibroblasts against the following proteins: cytokeratin 7/8, vimentin, Ki-67, Mamu-AG, Mamu-E and CD56. The proportion of cells that are stained (blue) or unstained (red) are represented as the % cells normalized to mode and the x-axis is the fluorescent intensity of the fluorophore. (C) Summary of the flow cytometric analysis represented as the mean and standard deviation (SD) of the median of fluorescence intensity across 7 TSC and EVT lines. A t-test was performed to assess differences in the median of fluorescence intensity between TSCs and EVTs. Control data including stained rhesus fetal fibroblasts and unstained TSCs and EVTs are also shown for comparison. (D) Secretion of MMP2 by EVTs compared to TSCs.

