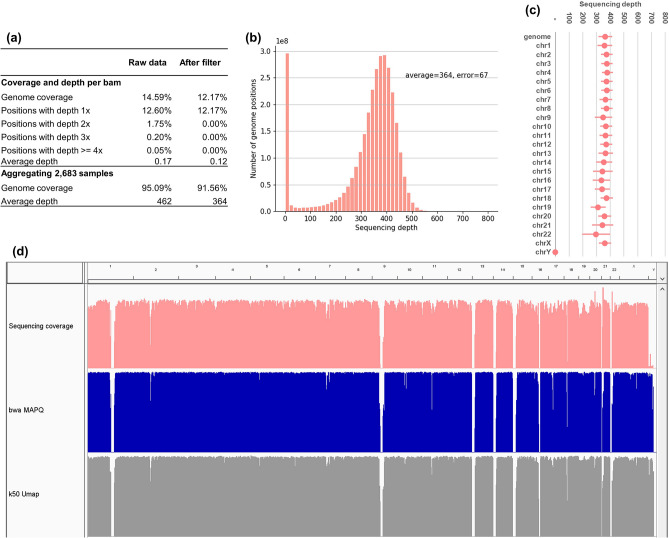
Figure 1.
Distributions of genome coverage and sequencing depth of the NIPT dataset. (a) Average genome coverage and sequencing depth per sample and from all samples combined. (b) Summary histogram of sequencing depth over all genome positions. (c) Distribution of sequencing depth per chromosome. (d) IGV tracks of sequencing depth, bwa MAPQ score, and Umap k50 mappability across the whole genome (the figure was produced using IGV, Integrative Genomics Viewer, version 2.8.924).

