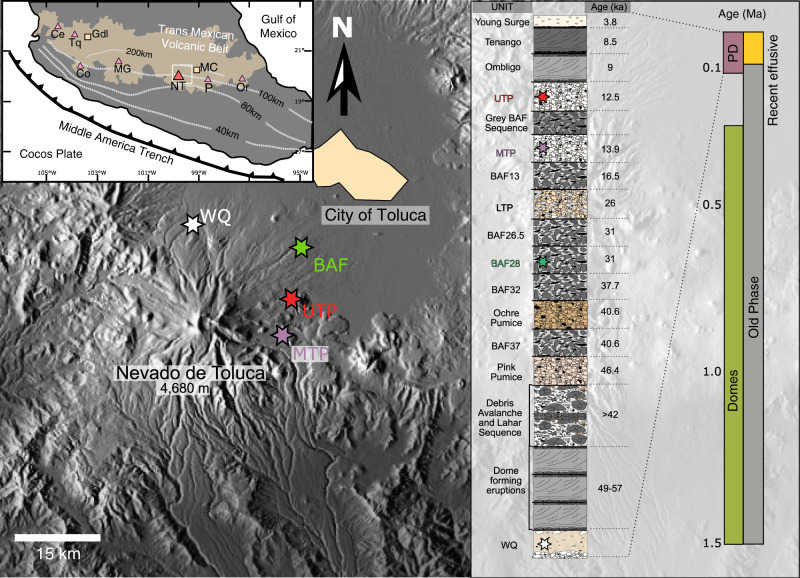
Fig. 1. Location and studied samples of Nevado de Toluca volcano.
Shaded relief map of the Toluca area is shown with sampling locations of 4 eruptions analyzed in this study marked by colored stars. Red star: Upper Toluca Pumice (UTP), purple: Middle Toluca Pumice (MTP), green: Block and Ash Flow (BAF28) and white: White Quarry Pyroclastic Flow (WQ). The inset on the far right shows the long-term 1.5 Ma eruptive history of Nevado de Toluca and division into eruptive episodes based on 40Ar/39Ar-geochronology39. The young pyroclastic sequence (PD) is shown as composite stratigraphic column, with indicated age relations of the eruptions based on radiocarbon dating36,37. The studied eruptions are marked by colored stars in the stratigraphic column. Inset on the top left shows the location of Mexico City (MC) and Guadalajara (Gdl), as well as the position of major volcanic centers (triangles) in the Neogene to recent Trans Mexican Volcanic Belt after ref. 68. Ce: Ceboruco, Tq: Tequila, Co: Colima, MG: Michoacán-Guanajuato, NT: Nevado de Toluca, P: Popocatépetl, Or: Pico de Orizaba. Dashed lines in the inset indicate the inferred depth of the subduction slab69.

