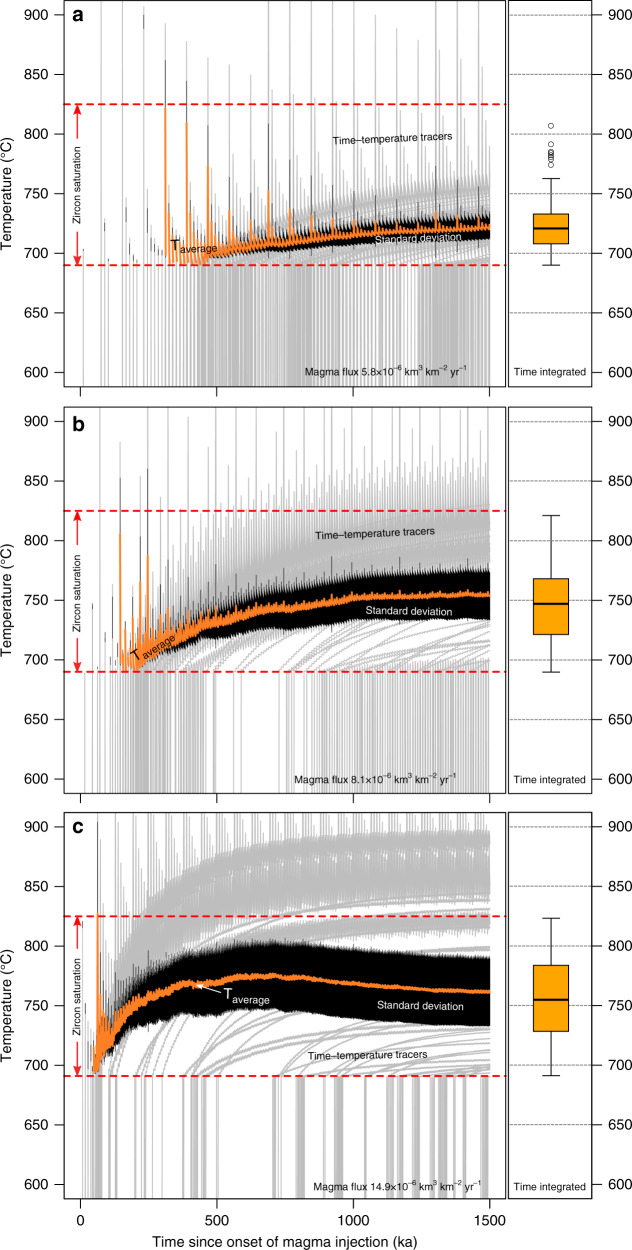
Fig. 4. Time-temperature evolution of modeled magmatic intrusions built by different recharge rates.
a Intrusion built with a magma flux of 5.8 × 10⁻⁶ km3 km−2 yr−1. b Reservoir built with a magma flux of 8.1 × 10⁻⁶ km3 km−2 yr−1 and (c) Intrusion built with magma flux of 14.9 × 10⁻⁶ km3 km−2 yr−1. In each subpanel, gray lines show the time-temperature path at a fixed position in the modeled magma reservoir (Time-temperature tracers). Note that only a small subset of the 500 randomly selected T–t paths used in the calculations is shown for the sake of clarity. The apparent high density of gray T–t tracers results from large temperature oscillations that individual tracers close to a magma injection site undergo during their evolution. The average temperature of the magma reservoir is given by the orange curves with 1 standard deviation indicated by black error bars. The temperature interval of zircon saturation (690–825 °C) used in the modeling is marked by red dashed curves. Boxplots on the right side of each plot show the time integrated and volumetrically constrained distributions of temperatures within zircon saturation for the three shown examples.

