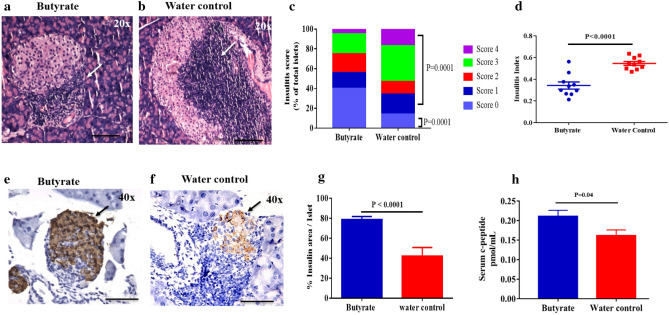
Figure 2.
Butyrate treatment reduces insulitis and preserves insulin content of the hyperglycemic NOD mice pancreas. Hyperglycemic NOD mice (age 15–25 weeks) were given sterile drinking water with or without sodium butyrate (150 mM) for six weeks. Insulitis was determined by haematoxylin and eosin staining of the pancreatic sections at six weeks post-treatment. Representative images showing immune cell infiltration in (a) Butyrate-treated and, (b) water control groups. Arrows show region of infiltration at 20 × magnification; scale bars indicate 200 µm. (c) The degree of insulitis was scored as percent of islets with score 0, score 1, score 2, score 3 and score 4 from butyrate treated (n = 9) and control mice (n = 9). Insulitis between treatment and control groups were compared using Fisher’s exact test. Minimum of 20 islets from each mice were evaluated for insulitis. (d) The insulitis index was calculated according to the formula: Insulitis index = (0 × n0) + (1 × n1) + (2 × n2) + (3 × n3) + (4 × n4) / 4 (n0 + n1 + n2 + n3 + n4). Insulin staining was determined by immunohistochemistry of the pancreatic sections at six weeks post treatment. Representative histological section of NOD mice pancreas showing insulin stained islets in (e) Butyrate treated hyperglycemic NOD mice and, (f) Untreated hyperglycemic NOD mice. Arrows show region of infiltration at 40 × magnification; scale bars indicate 100 µm. (g) Immunohistochemical analysis of the insulin stained pancreatic islets from butyrate-treated (n = 5) or control (n = 4) NOD mice was determined by the percentage ratio of insulin-cell stained area to the total area of the same islet using Image J software. More than 50 islets from each group were evaluated for insulin staining. Post-six weeks treatment of hyperglycemic NOD mice, (h) serum C-peptide levels from treatment (n = 10) and control (n = 14) mice were determined by ELISA. Data are shown as mean ± SEM. Statistical significance between treatment and control groups was determined by Mann–Whitney U test, with P < 0.05 considered as significant.

