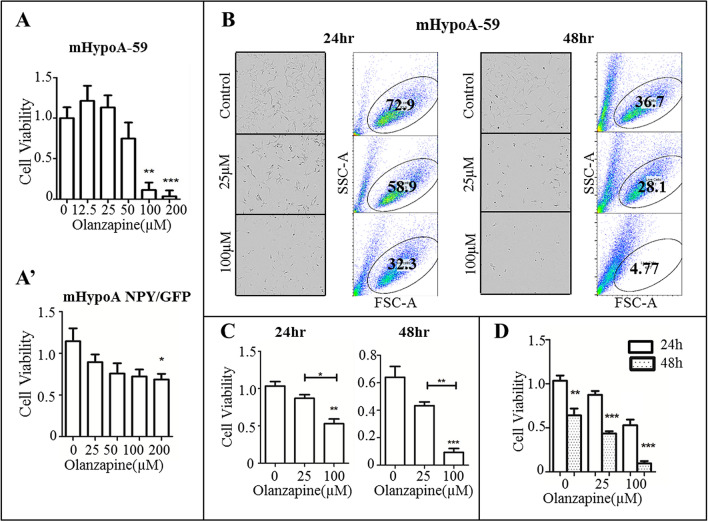
Figure 1.
Olanzapine induced neuronal toxicity in a dose and time-dependent manner. (A) mHypoA-59 neurons and (A’) mHypoA NPY/GFP neurons were incubated with various concentrations of olanzapine for 24hrs and cell viability was assessed using an MTS assay (B–D) mHypoA-59 neurons were then treated with either 25 or 100 µM of olanzapine for 24 or 48hrs, cells were imaged using a live-cell imager and quantified by flow cytometry. (*p < 0.05, ** p < 0.01, ***p < 0.001 compared to the control group, and compared to 24 hr in Fig. 1D. Data is presented as mean ± SEM).

