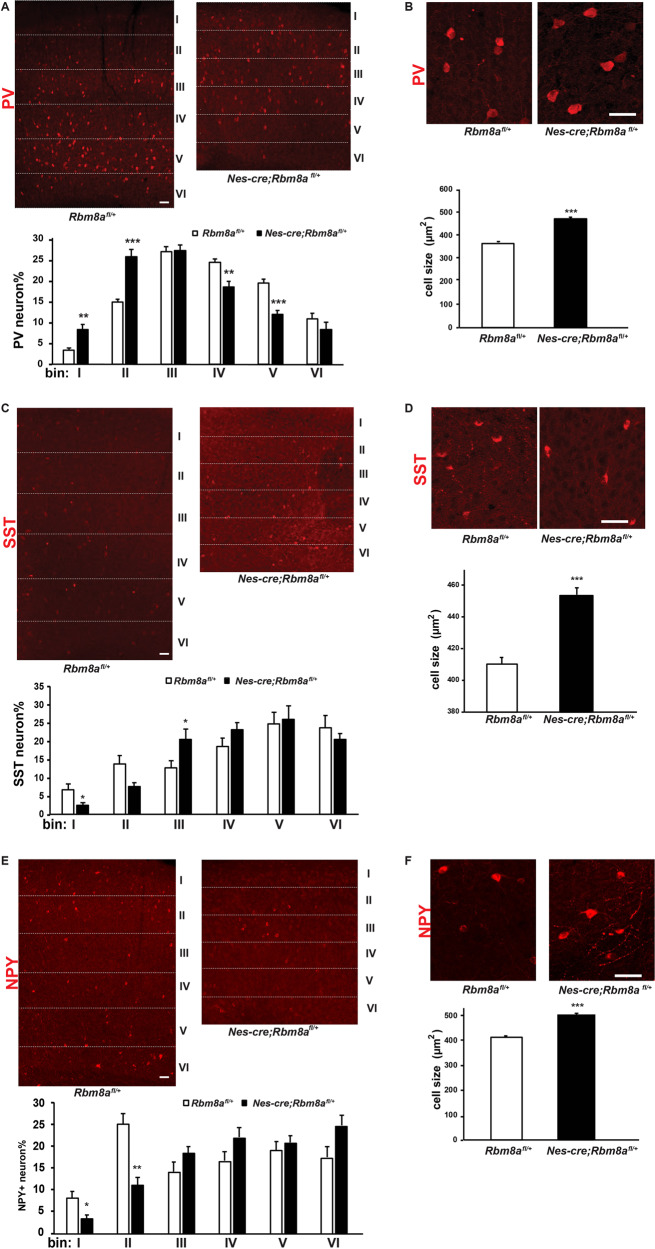
Fig. 3. Rbm8a regulates the generation and migration of PV+, SST+, and NPY+ interneurons.
A Cell number of PV+ interneurons was decreased, and the distribution of PV+ interneurons was altered in the cortex of Nes-cre; Rbm8afl/+ mice. Scale bar = 50 µm. Quantification of the distribution of PV+ interneurons in the cortex. There are significantly altered PV+ interneurons in bins I, II, IV, and V compared to Rbm8afl/+ mice (**p < 0.01, ***p < 0.0001; t test, n = 3). B PV+ cells in Nes-cre; Rbm8afl/+ mice are significantly larger than in Rbm8afl/+ mice. Scale bar = 50 µm. Quantification of the size of PV+ interneurons (***p < 0.001; t test; δ = 0.562; Cohens δ). C Nes-cre; Rbm8afl/+ mice have altered distribution of SST+ interneurons in the cortex. Scale bar = 50 µm. Quantification of the distribution of SST+ interneurons in the cortex. There are significant changes of SST+ interneurons in bins I and III, compared to Rbm8afl/+ mice (*p < 0.05; t test, n = 3). D SST+ cells in Nes-cre; Rbm8afl/+ mice are significantly larger than in Rbm8afl/+ mice. Scale bar = 50 µm. Quantification of the size of SST+ interneurons in the cortex (***p < 0.001; t test; δ = 0.359; Cohens δ). E Nes-cre; Rbm8afl/+ mice showed altered distribution of NPY+ interneurons in the cortex. Scale bar = 50 µm. There are significantly fewer NPY+ interneurons in bins I and II, compared to Rbm8afl/+ mice (*p < 0.05, **p < 0.01; t test, n = 3). F NPY+ cells in Nes-cre; Rbm8afl/+ mice are significantly larger than in Rbm8afl/+ mice. Scale bar, 50 µm. Quantification of the size of NPY+ interneurons in the cortex (***p < 0.001; t test; δ = 0.793; Cohens δ).

