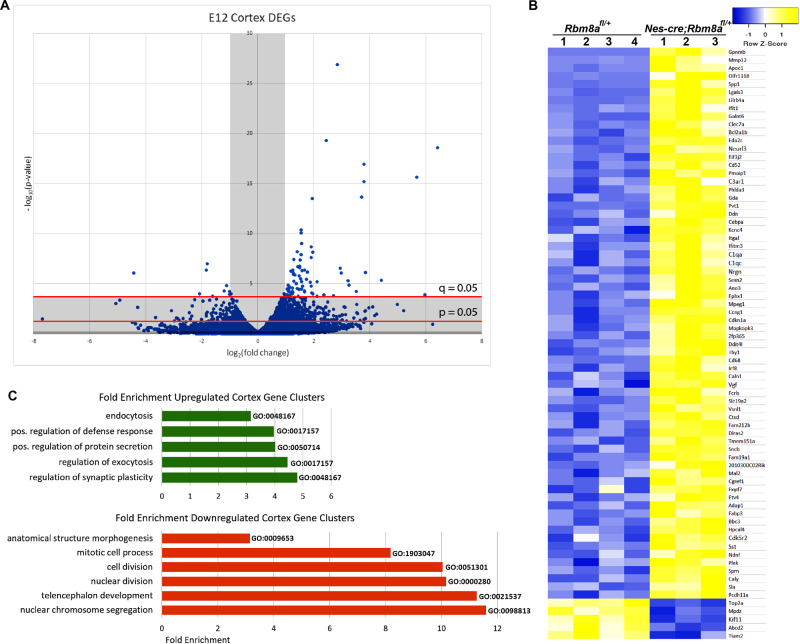
Fig. 5. RNAseq analyses of all quantifiable expression changes in the cortex of Rbm8a cKO mice at E12.
A Volcano plot of 28,117 genes’ transcripts detected in the RNAseq data. A total of 1073 genes were expressed differently with p < 0.05, 430 genes were expressed differently with p < 0.01, and 87 genes were expressed differently with q < 0.05. A total of 84 DEGs with significant q values were upregulated or downregulated at least twofold. The p and q cutoffs are shown. B Heat map of RNA transcript readings for all known genes with significant expression changes in the E12 cKO mouse cortex (q < 0.05). From the RNAseq data, the transcript counts of each gene were compared between the six mice. Of the 87 DEGs, 14 remain uncharacterized and have been excluded from the figure. C Enriched gene clusters of the E12 cortex regulated endocytosis, immune responses, cell secretions, and synaptic plasticity. Depleted gene clusters of the E12 cortex were mainly involved in cell cycle processes. Enriched gene clusters were identified among upregulated and downregulated genes. Selected clusters with more than twofold enrichment are shown with their GO accession numbers to the left of the bars.

