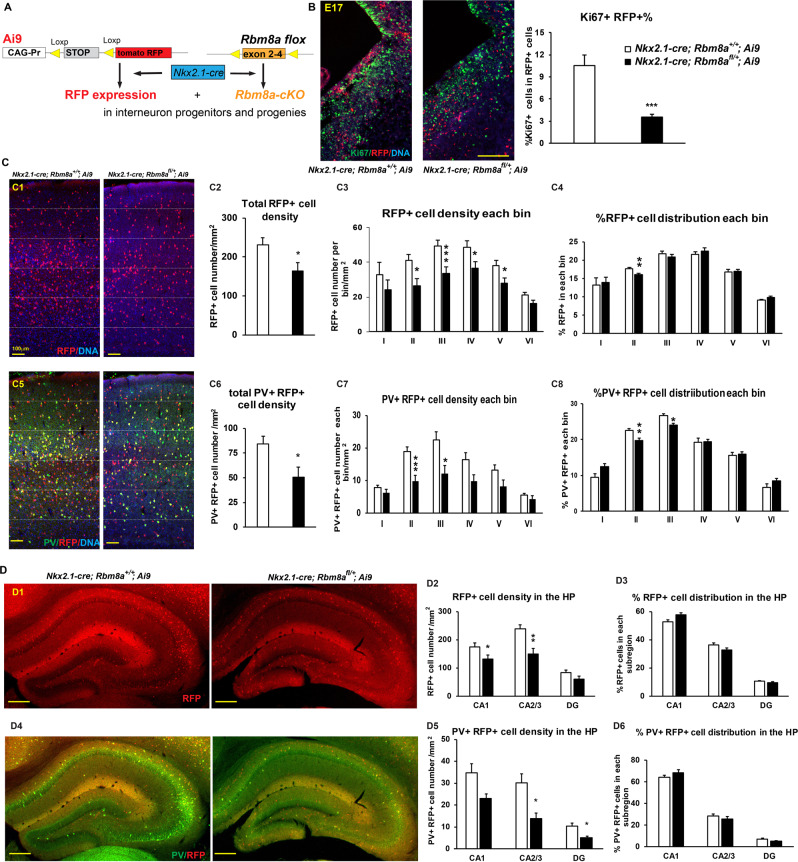
Fig. 6. Altered interneuron distribution and number in Nkx2.1-cre; Rbm8afl/+ mice.
A Generation of Nkx2.1-cre; Rbm8afl/+; Ai9 mouse model. B Mice have significantly fewer proliferating RFP+ cells in the GE on E17. Scale bar = 50 µm. Quantification of the percentage of proliferating Ki67+ cells normalizing to total RFP+ cells in the GE (***p < 0.001; t test, n = 3). C Analyses of total RFP+ cells in the DLPFC of Nkx2.1-cre; Rbm8a+/+; Ai9 and Nkx2.1-cre; Rbm8afl/+; Ai9 mice. (C1) Representative figures show RFP+ cells in the DLPFC of Nkx2.1-cre; Rbm8a+/+; Ai9 and Nkx2.1-cre; Rbm8afl/+; Ai9 mice. Scale bar = 50 µm. (C2) Quantification of total RFP+ cell density in the DLPFC of Nkx2.1-cre; Rbm8a+/+; Ai9 and Nkx2.1-cre; Rbm8afl/+; Ai9 mice. (C3) Quantification of RFP+ cell density in each bin of the DLPFC. The bar graph shows the RFP+ cell number in each bin divided by area. (C4) Quantification of percentages of RFP+ cells in each bin of the DLPFC. The bar graph shows the percentage of RFP+ cells in each bin to total RFP+ cells in all bins. (C5) Co-immunostaining of PV interneurons in the section shown in C1. Scale bar = 50 µm. (C6) Quantification of total PV+ and RFP+ cell density in the DLPFC. (C7) Quantification of PV+ RFP+ cell density in each bin of the DLPFC. (C8) Quantification of percentages of PV+ RFP+ cells in each bin of the DLPFC. D Analyses of total RFP+ cells in the HP of Nkx2.1-cre; Rbm8a+/+; Ai9 and Nkx2.1-cre; Rbm8afl/+; Ai9 mice. (D1) Representative figures show RFP+ cells in the HP of Nkx2.1-cre; Rbm8a+/+; Ai9 and Nkx2.1-cre; Rbm8afl/+; Ai9 mice. Scale bar = 50 µm. (D2) Quantification of RFP+ cell density in subregions of the HP. The bar graph shows the RFP+ cell number in each subregion divided by area. (D3) Quantification of percentages of RFP+ cells in each subregion of the HP. The bar graph shows the percentage of RFP+ cells in each subregion to total RFP+ cells in the whole HP. (D4) Co-immunostaining of PV interneurons in the section shown in D1. Scale bar = 50 µm. (D5) Quantification of PV+ RFP+ cell density in subregions of the HP. (D6) Quantification of percentages of PV+ RFP+ cells in each subregion of the HP. *p < 0.05; **p < 0.01; ***p < 0.001, t test, n = 3. Bar graphs represent means ± SEMs.

