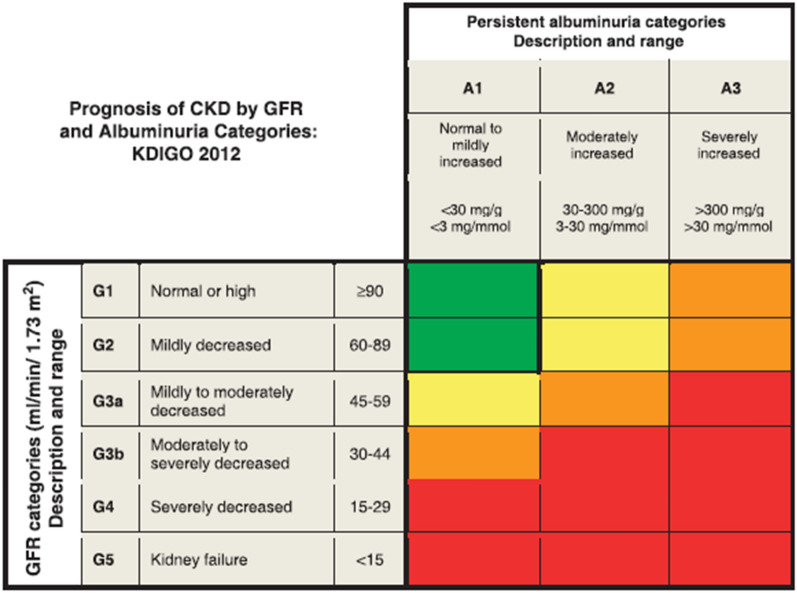
Fig. 1.
Diagnostic and prognostic criteria for chronic kidney disease. The GFR and albuminuria grid depicts the risk of progression, morbidity, and mortality by color, from best (low risk; green) to worst (red; very high risk) (green → yellow [moderately increased risk] → orange [high risk] → red). CKD Chronic kidney disease, GFR glomerular filtration rate, KDIGO Kidney Disease: Improving Global Outcomes. (Reproduced with permission from KDIGO 2012 [19])

