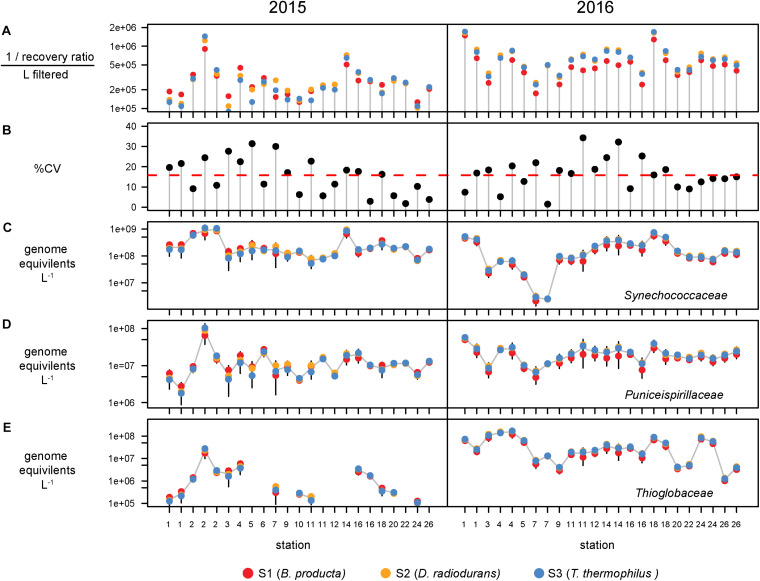
FIGURE 3.
Recovery and variation of the three internal standards and the effect on taxa volumetric abundances. (A) Recovery ratio derived from Blautia producta (red), Deinococcus radiodurans, (gold), and Thermus thermophilus (blue) internal genomic standards for the 47 metagenomes. (B) Percent coefficient of variation (%CV = standard deviation/mean × 100) of the three standards. Red dashed line shows the mean %CV of the 47s metagenomes. Volumetric abundances of three families, (C) Synechococcaceae, (D) Puniceispirillaceae (SAR116 clade), and (E) Thioglobaceae derived from each internal standard. Error bars denote the 95% confidence intervals (t distribution) determined from the three internal standards for each metagenome.

