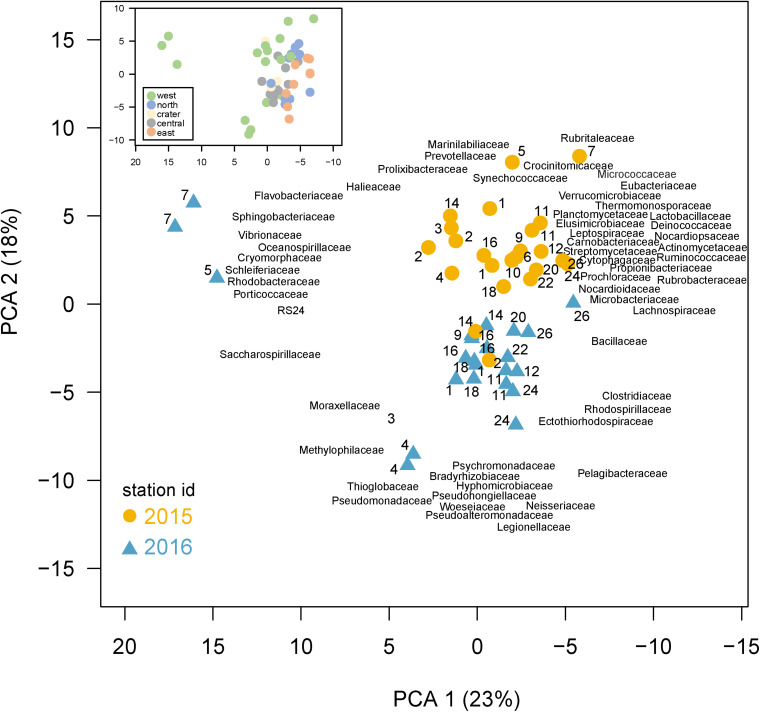
FIGURE 5.
Differences in community composition across the Galápagos Archipelago. Principal components analysis (PCA) based on the recA abundances of the top 100 families in the metagenomes. Percent variance explained by each axis is shown in parentheses. Samples are colored based on year collected (2015, gold circle; 2016, blue triangle) with the site number next to the sample symbol. The bacterial family loadings are plotted with left justification. Inset: the same PCA as shown in the main plot, but with samples color-coded according to the geographic region of their collection in the archipelago.

