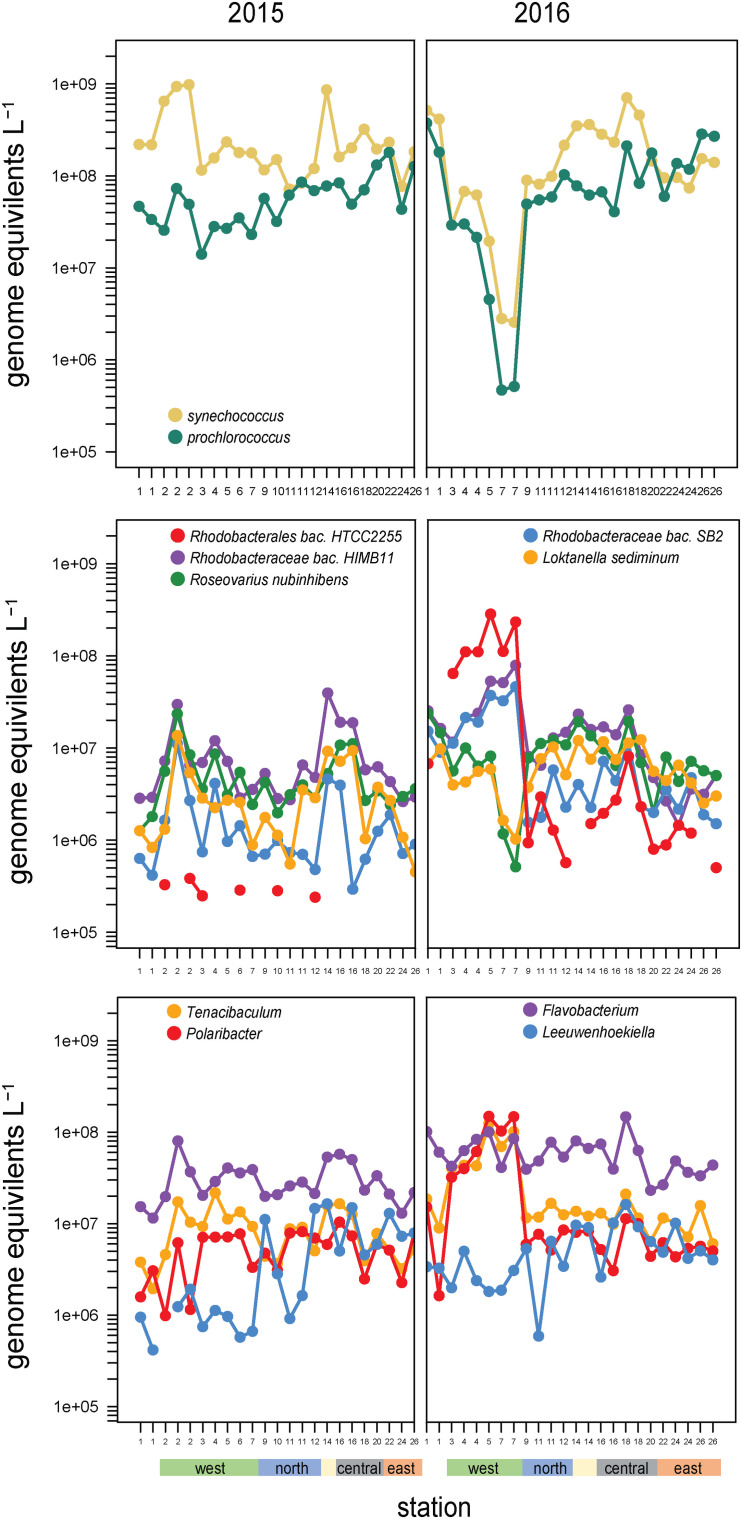
FIGURE 6.
Abundances and composition across the archipelago of select taxa within (top) the cyanobacteria, (middle) the Roseobacter clade, and (bottom) Flavobacteriaceae genera in 2015 (left) and 2016 (right). The color bar at the bottom of the graph denotes a station’s geographic region as shown in Figure 1E.

