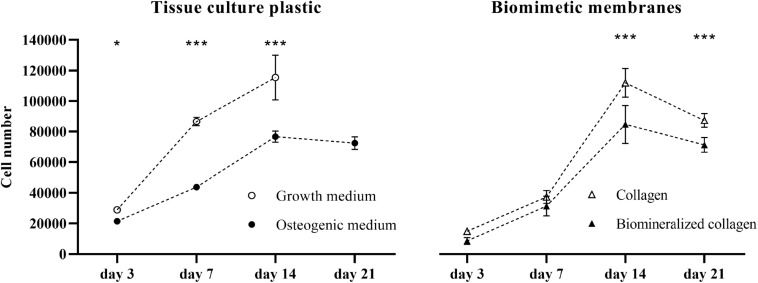
FIGURE 2.
Proliferation of hMSCs on tissue culture plastic in GM and OM as well as on the biomimetic collagen and biomineralized collagen membranes in GM. Cell proliferation is expressed as cell number at 3, 7, 14, and 21 days of culture. The data point for 21 days in the GM condition is missing, due to cells becoming over-confluent and eventually detaching from the tissue culture plate. Data are represented as mean ± SD (n = 6). Data is presented as mean and standard deviation and significance is denoted as *p < 0.05, ***p < 0.001.

