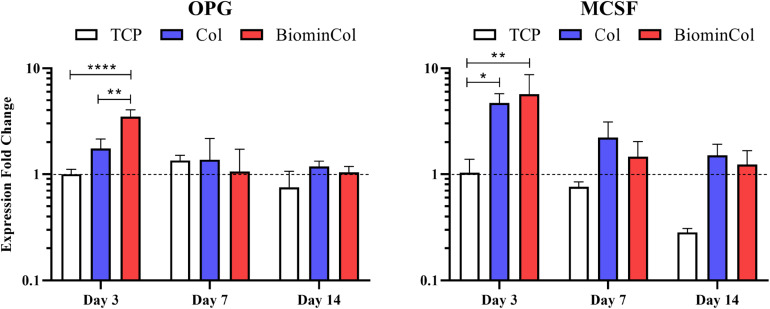
FIGURE 4.
Gene expression profiles for OPG and MCSF of hMSCs cultured on tissue culture plastic (TCP) control, collagen (Col), and biomineralized collagen (BiominCol) for 3, 7, and 14 days. Data are represented as mean ± SD (n = 3). Data is presented as mean and standard deviation and significance is denoted as *p < 0.05, **p < 0.01, ****p < 0.0001.

