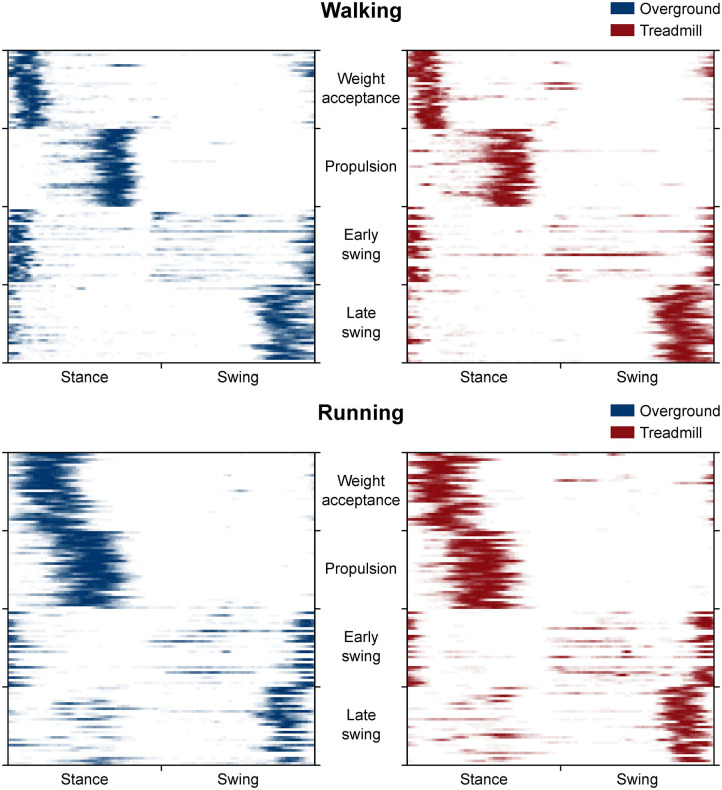
Figure 6.
Heat maps representing the average occurrence of values bigger than half maximum for each trial (rows of the maps). We calculated trial by trial, for each of the 200 time points (columns of the maps) and gait cycle, the number of times a motor primitive was exceeding half maximum and reported the mean results in a color-coded fashion: from white (the primitive never exceeded half maximum) to blue or red (the primitive exceeded half maximum in all the 30 gait cycles of that trial). Missing primitives are reported as fully white rows.

